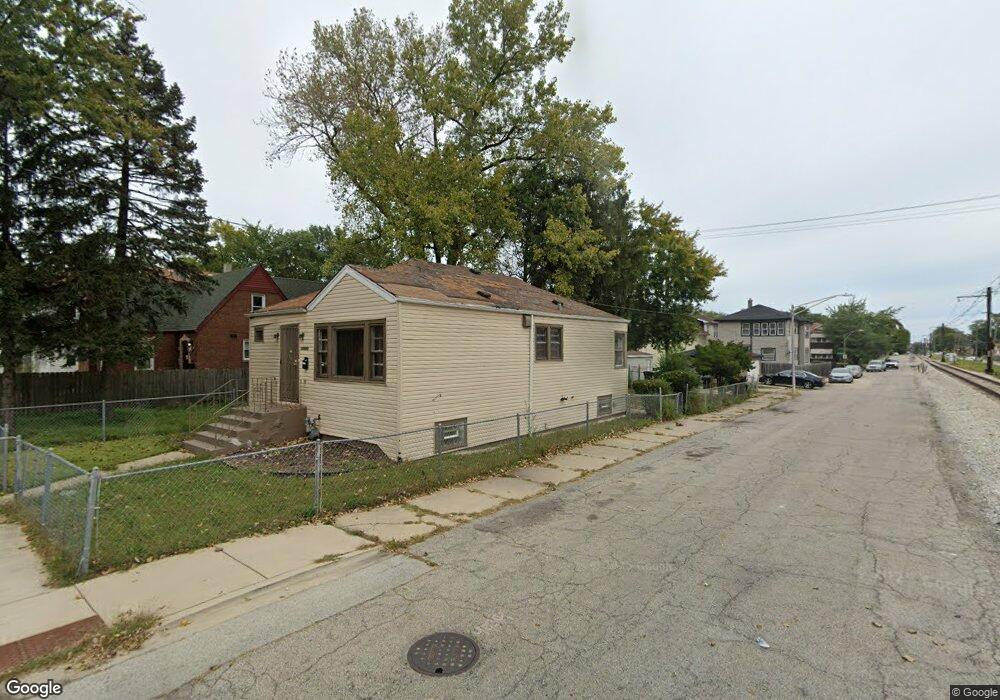
12057 S Wentworth Ave Chicago, IL 60628
West Pullman NeighborhoodEstimated Value: $85,000 - $128,000
2
Beds
1
Bath
960
Sq Ft
$104/Sq Ft
Est. Value
About This Home
This home is located at 12057 S Wentworth Ave, Chicago, IL 60628 and is currently estimated at $100,148, approximately $104 per square foot. 12057 S Wentworth Ave is a home located in Cook County with nearby schools including Curtis Elementary School, Fenger Academy High School, and Chicago Collegiate Charter School.
Ownership History
Date
Name
Owned For
Owner Type
Purchase Details
Closed on
Mar 11, 2011
Sold by
Stokes Legrant
Bought by
Hampton Philip C
Current Estimated Value
Purchase Details
Closed on
Jan 14, 2010
Sold by
Us Bank National Association
Bought by
Stokes Legrant
Purchase Details
Closed on
Oct 29, 2009
Sold by
Jackson Eugene
Bought by
Us Bank National Association
Purchase Details
Closed on
Dec 18, 2001
Sold by
Chase Manhattan Bank
Bought by
Jackson Eugene
Home Financials for this Owner
Home Financials are based on the most recent Mortgage that was taken out on this home.
Original Mortgage
$28,800
Interest Rate
7.07%
Purchase Details
Closed on
Aug 24, 2001
Sold by
Neinhard Claudia
Bought by
Fairbanks Capital Corp and Chase Manhattan Bank
Purchase Details
Closed on
Sep 9, 1993
Sold by
Nemhard Claudia
Bought by
Nemhard Robert
Create a Home Valuation Report for This Property
The Home Valuation Report is an in-depth analysis detailing your home's value as well as a comparison with similar homes in the area
Home Values in the Area
Average Home Value in this Area
Purchase History
| Date | Buyer | Sale Price | Title Company |
|---|---|---|---|
| Hampton Philip C | -- | None Available | |
| Stokes Legrant | $7,500 | Premier Title | |
| Us Bank National Association | -- | Premier Title | |
| Jackson Eugene | $36,000 | First American Title | |
| Fairbanks Capital Corp | -- | -- | |
| Nemhard Robert | -- | -- |
Source: Public Records
Mortgage History
| Date | Status | Borrower | Loan Amount |
|---|---|---|---|
| Previous Owner | Jackson Eugene | $28,800 |
Source: Public Records
Tax History Compared to Growth
Tax History
| Year | Tax Paid | Tax Assessment Tax Assessment Total Assessment is a certain percentage of the fair market value that is determined by local assessors to be the total taxable value of land and additions on the property. | Land | Improvement |
|---|---|---|---|---|
| 2024 | $740 | $7,800 | $2,356 | $5,444 |
| 2023 | $722 | $3,500 | $1,571 | $1,929 |
| 2022 | $722 | $3,500 | $1,571 | $1,929 |
| 2021 | $706 | $3,499 | $1,570 | $1,929 |
| 2020 | $1,919 | $8,591 | $2,159 | $6,432 |
| 2019 | $1,902 | $9,441 | $2,159 | $7,282 |
| 2018 | $1,870 | $9,441 | $2,159 | $7,282 |
| 2017 | $1,651 | $7,651 | $1,963 | $5,688 |
| 2016 | $1,536 | $7,651 | $1,963 | $5,688 |
| 2015 | $1,406 | $7,651 | $1,963 | $5,688 |
| 2014 | $1,385 | $7,446 | $1,767 | $5,679 |
| 2013 | $1,357 | $7,446 | $1,767 | $5,679 |
Source: Public Records
Map
Nearby Homes
- 12051 S La Salle St
- 12039 S Yale Ave
- 12136 S Wentworth Ave
- 12050 S Yale Ave
- 11944 S Perry Ave
- 11949 S Yale Ave
- 11947 S Perry Ave
- 12157 S Perry Ave
- 11935 S Perry Ave
- 11921 S Wentworth Ave
- 11940 S Yale Ave
- 11922 S Perry Ave
- 12217 S La Salle St
- 12220 S La Salle St
- 11912 S Yale Ave
- 11925 S Lafayette Ave
- 12211 S Lafayette Ave
- 12251 S Yale Ave
- 11956 S Harvard Ave
- 11845 S Perry Ave
- 12053 S Wentworth Ave
- 12051 S Wentworth Ave
- 12047 S Wentworth Ave
- 12043 S Wentworth Ave
- 12056 S La Salle St Unit 1
- 12056 S La Salle St
- 12101 S Wentworth Ave
- 12052 S La Salle St
- 12052 S La Salle St Unit 2
- 12050 S La Salle St
- 12105 S Wentworth Ave
- 12041 S Wentworth Ave
- 12041 S Wentworth Ave Unit 2
- 12046 S La Salle St
- 12054 S Wentworth Ave
- 12050 S Wentworth Ave
- 12100 S La Salle St
- 12042 S La Salle St
- 12035 S Wentworth Ave
- 12035 S Wentworth Ave