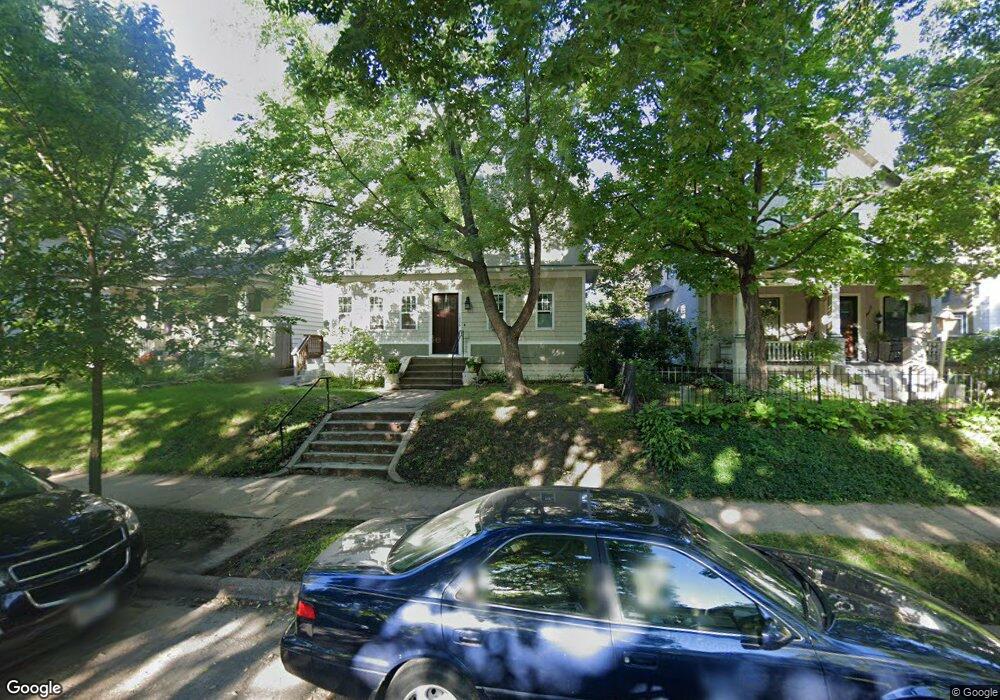
1206 Adams St NE Unit Upper Minneapolis, MN 55413
Logan Park NeighborhoodEstimated Value: $359,000 - $559,000
2
Beds
1
Bath
2,912
Sq Ft
$165/Sq Ft
Est. Value
About This Home
This home is located at 1206 Adams St NE Unit Upper, Minneapolis, MN 55413 and is currently estimated at $481,474, approximately $165 per square foot. 1206 Adams St NE Unit Upper is a home located in Hennepin County with nearby schools including Pillsbury Elementary School, Northeast Middle School, and Thomas Edison High School.
Ownership History
Date
Name
Owned For
Owner Type
Purchase Details
Closed on
Mar 23, 2018
Sold by
Ne Holdings Llc
Bought by
Hueler Gregory A
Current Estimated Value
Purchase Details
Closed on
Oct 27, 2017
Sold by
Free Beverly J
Bought by
Ne Holdings Llc
Home Financials for this Owner
Home Financials are based on the most recent Mortgage that was taken out on this home.
Original Mortgage
$321,000
Interest Rate
3.78%
Mortgage Type
Future Advance Clause Open End Mortgage
Purchase Details
Closed on
Dec 7, 2001
Sold by
Helgeson Peter J and Helgeson Tonia
Bought by
Free Beverly J
Create a Home Valuation Report for This Property
The Home Valuation Report is an in-depth analysis detailing your home's value as well as a comparison with similar homes in the area
Home Values in the Area
Average Home Value in this Area
Purchase History
| Date | Buyer | Sale Price | Title Company |
|---|---|---|---|
| Hueler Gregory A | -- | Carver County Abstract & Tit | |
| Ne Holdings Llc | $348,000 | Watermark Title Ageny | |
| Free Beverly J | $349,900 | -- |
Source: Public Records
Mortgage History
| Date | Status | Borrower | Loan Amount |
|---|---|---|---|
| Previous Owner | Ne Holdings Llc | $321,000 |
Source: Public Records
Tax History Compared to Growth
Tax History
| Year | Tax Paid | Tax Assessment Tax Assessment Total Assessment is a certain percentage of the fair market value that is determined by local assessors to be the total taxable value of land and additions on the property. | Land | Improvement |
|---|---|---|---|---|
| 2024 | $10,723 | $588,000 | $142,000 | $446,000 |
| 2023 | $9,422 | $589,000 | $139,000 | $450,000 |
| 2022 | $8,052 | $512,000 | $126,000 | $386,000 |
| 2021 | $6,728 | $474,000 | $69,000 | $405,000 |
| 2020 | $7,279 | $411,800 | $36,100 | $375,700 |
| 2019 | $6,807 | $411,800 | $36,100 | $375,700 |
| 2018 | $4,988 | $375,000 | $34,900 | $340,100 |
| 2017 | $4,521 | $300,000 | $31,700 | $268,300 |
| 2016 | $4,378 | $283,000 | $31,700 | $251,300 |
| 2015 | $3,923 | $245,500 | $31,700 | $213,800 |
| 2014 | -- | $213,500 | $30,200 | $183,300 |
Source: Public Records
Map
Nearby Homes
- 1222 6th St NE
- 1408 Washington St NE
- 1426 Washington St NE
- 1538 N Washington Ave
- 1218 University Ave NE
- 1419 University Ave NE
- 1609 4th St NE
- 451 Madison St NE
- 428 Madison St NE
- 1523 3rd St NE
- 1732 Jefferson St NE
- 1730 5th St NE
- 417 4th Ave NE
- 916 14th Ave NE
- 601 Jackson St NE
- 653 19th Ave NE
- 215 7th St NE Unit 209
- 1730 3rd St NE
- 613 Harrison St NE
- 2001 Washington St NE
- 1206 Adams St NE
- 1206 Adams St NE Unit Lower
- 1206 Adams St NE Unit 1
- 1202 Adams St NE
- 1210 Adams St NE
- 1136 Adams St NE
- 1220 Adams St NE
- 1132 Adams St NE
- 1222 Adams St NE
- 1207 Washington St NE
- 1211 Washington St NE
- 1203 Washington St NE
- 1226 Adams St NE
- 1139 Washington St NE
- 1213 Washington St NE
- 1130 Adams St NE
- 1135 Washington St NE
- 1219 Washington St NE
- 1207 Adams St NE
- 1211 Adams St NE