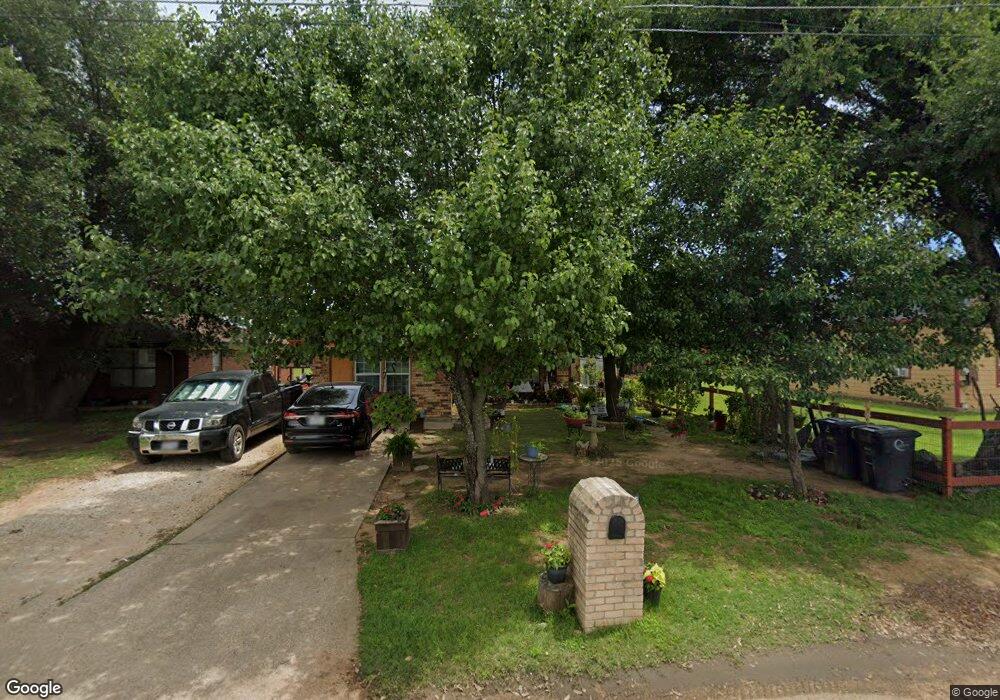
1206 Chase Ave Cleburne, TX 76031
Estimated Value: $183,000 - $236,000
3
Beds
1
Bath
1,337
Sq Ft
$154/Sq Ft
Est. Value
About This Home
This home is located at 1206 Chase Ave, Cleburne, TX 76031 and is currently estimated at $206,405, approximately $154 per square foot. 1206 Chase Ave is a home located in Johnson County with nearby schools including Irving Elementary School, A.D. Wheat Middle School, and Cleburne High School.
Ownership History
Date
Name
Owned For
Owner Type
Purchase Details
Closed on
Oct 23, 2019
Sold by
Rojas Margarito
Bought by
Galarza Martin Ruben and Galarza Luz Elena
Current Estimated Value
Home Financials for this Owner
Home Financials are based on the most recent Mortgage that was taken out on this home.
Original Mortgage
$75,000
Outstanding Balance
$45,281
Interest Rate
3.5%
Mortgage Type
Purchase Money Mortgage
Estimated Equity
$161,124
Purchase Details
Closed on
Nov 15, 2006
Sold by
Rojas Margarito
Bought by
Rojas Margarito
Create a Home Valuation Report for This Property
The Home Valuation Report is an in-depth analysis detailing your home's value as well as a comparison with similar homes in the area
Home Values in the Area
Average Home Value in this Area
Purchase History
| Date | Buyer | Sale Price | Title Company |
|---|---|---|---|
| Galarza Martin Ruben | -- | None Available | |
| Rojas Margarito | -- | Fatco |
Source: Public Records
Mortgage History
| Date | Status | Borrower | Loan Amount |
|---|---|---|---|
| Open | Galarza Martin Ruben | $75,000 |
Source: Public Records
Tax History
| Year | Tax Paid | Tax Assessment Tax Assessment Total Assessment is a certain percentage of the fair market value that is determined by local assessors to be the total taxable value of land and additions on the property. | Land | Improvement |
|---|---|---|---|---|
| 2025 | $1,044 | $141,943 | $43,000 | $98,943 |
| 2024 | $2,342 | $105,032 | $0 | $0 |
| 2023 | $889 | $122,443 | $23,500 | $98,943 |
| 2022 | $2,172 | $122,443 | $23,500 | $98,943 |
| 2021 | $2,059 | $122,443 | $23,500 | $98,943 |
| 2020 | $1,988 | $71,739 | $20,000 | $51,739 |
| 2019 | $1,770 | $71,739 | $20,000 | $51,739 |
| 2018 | $1,610 | $54,462 | $7,500 | $46,962 |
| 2017 | $1,603 | $54,462 | $7,500 | $46,962 |
| 2016 | $1,603 | $54,462 | $7,500 | $46,962 |
Source: Public Records
Map
Nearby Homes
- 1109 Chase Ave
- 1205 Boone St
- 1103 Chase Ave
- 707 Cedar St
- 812 Barber Ave
- 301 Eastland St
- 206 Hix Rd
- 316 Liberty St
- 616 Sabine Ave
- 1609 N Brazos Ave
- 222 Hix Rd
- 604 Crockett Dr
- 612 Crockett Dr
- 616 Crockett Dr
- 602 Sabine Ave
- 621 Crockett Dr
- 211 Huron St
- 906 N Wilhite St
- 1210 N Robinson St
- 1313 N Robinson St
Your Personal Tour Guide
Ask me questions while you tour the home.