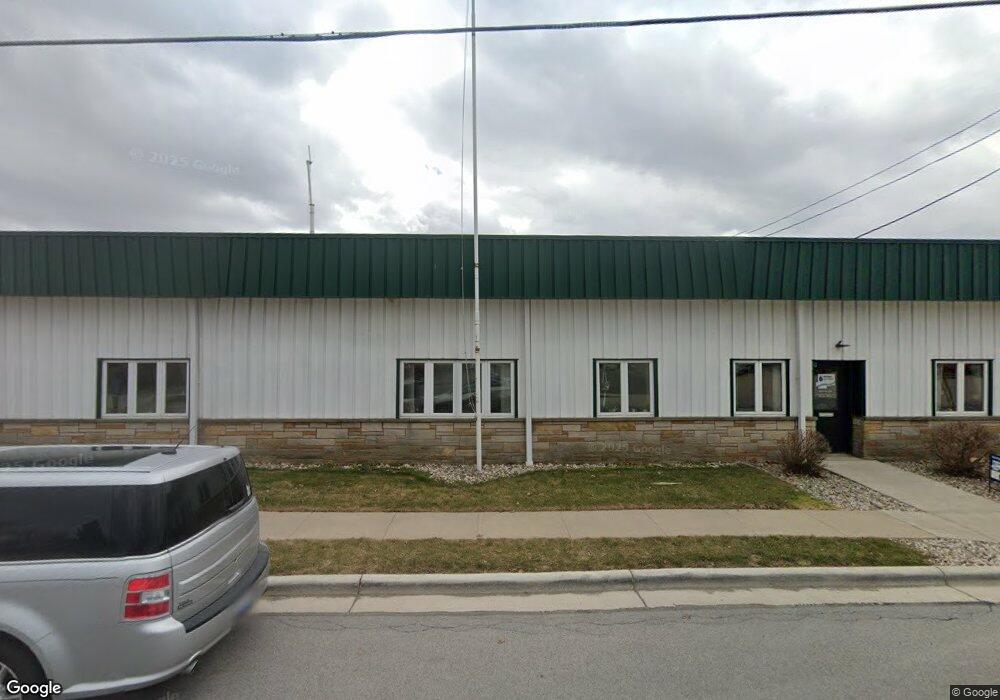
1206 E 2nd St Ottawa, OH 45875
Estimated Value: $193,000 - $583,657
Studio
2
Baths
330,000
Sq Ft
$1/Sq Ft
Est. Value
About This Home
This home is located at 1206 E 2nd St, Ottawa, OH 45875 and is currently estimated at $348,886, approximately $1 per square foot. 1206 E 2nd St is a home located in Putnam County with nearby schools including Ottawa-Glandorf High School and Sts. Peter & Paul Catholic School.
Ownership History
Date
Name
Owned For
Owner Type
Purchase Details
Closed on
Jul 25, 2023
Sold by
Weis William R and Mangas Edward G
Bought by
Weis Eric W
Current Estimated Value
Purchase Details
Closed on
Dec 16, 2010
Sold by
Denune Ralph
Bought by
Byproducts Sales & Distribution Llc
Home Financials for this Owner
Home Financials are based on the most recent Mortgage that was taken out on this home.
Original Mortgage
$151,000
Interest Rate
4.44%
Mortgage Type
Future Advance Clause Open End Mortgage
Create a Home Valuation Report for This Property
The Home Valuation Report is an in-depth analysis detailing your home's value as well as a comparison with similar homes in the area
Home Values in the Area
Average Home Value in this Area
Purchase History
| Date | Buyer | Sale Price | Title Company |
|---|---|---|---|
| Weis Eric W | $135,500 | None Listed On Document | |
| Byproducts Sales & Distribution Llc | $189,000 | Attorney |
Source: Public Records
Mortgage History
| Date | Status | Borrower | Loan Amount |
|---|---|---|---|
| Previous Owner | Byproducts Sales & Distribution Llc | $151,000 |
Source: Public Records
Tax History
| Year | Tax Paid | Tax Assessment Tax Assessment Total Assessment is a certain percentage of the fair market value that is determined by local assessors to be the total taxable value of land and additions on the property. | Land | Improvement |
|---|---|---|---|---|
| 2025 | $3 | $244,820 | $91,270 | $153,550 |
| 2024 | -- | $244,820 | $91,270 | $153,550 |
| 2023 | $0 | $126,110 | $86,780 | $39,330 |
| 2022 | $0 | $126,109 | $86,779 | $39,330 |
| 2021 | $4,071 | $126,110 | $86,780 | $39,330 |
| 2020 | $4,071 | $92,510 | $51,380 | $41,130 |
| 2019 | $5,497 | $126,110 | $86,780 | $39,330 |
| 2018 | $5,497 | $126,110 | $86,780 | $39,330 |
| 2017 | $4,071 | $126,110 | $86,780 | $39,330 |
| 2016 | $4,071 | $92,510 | $51,380 | $41,130 |
| 2015 | $4,095 | $92,510 | $51,380 | $41,130 |
| 2014 | $4,097 | $92,510 | $51,380 | $41,130 |
| 2013 | $2,884 | $67,340 | $25,690 | $41,650 |
Source: Public Records
Map
Nearby Homes
- 238 N Ohio Ave
- 740 E Main St
- 1535 E 3rd St
- 717 E 2nd St
- 370 S Thomas St
- 1823 S Agner St
- 0 Sapphire St Unit 225029940
- 0 Sapphire St Unit 225046385
- 1997 E Main St
- 715 N Perry St
- 717 & 717 1/2 & 721 E Third St
- 309 Oakview Dr
- #7 Oakview Dr
- #10 Oakview Dr
- #1 Oakview Dr
- #8 Oakview Dr
- #11 Oakview Dr
- #4 Oakview Dr
- #6 Oakview Dr
- #2 Oakview Dr
Your Personal Tour Guide
Ask me questions while you tour the home.