Estimated Value: $535,386 - $580,000
4
Beds
3
Baths
1,990
Sq Ft
$280/Sq Ft
Est. Value
About This Home
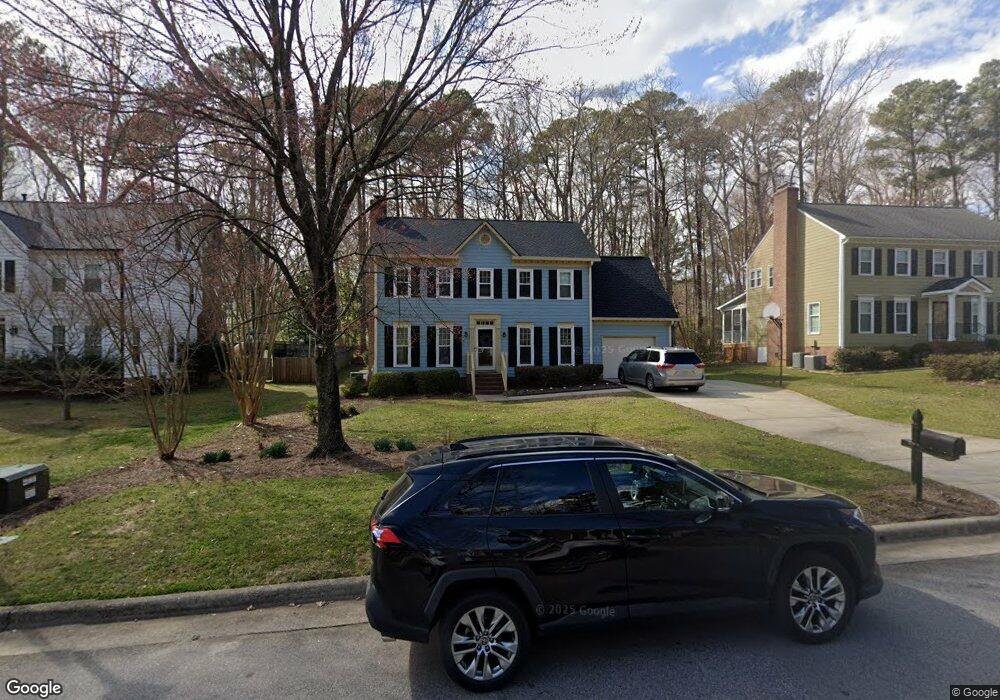
This home is located at 1206 Eastham Dr, Apex, NC 27502 and is currently estimated at $557,347, approximately $280 per square foot. 1206 Eastham Dr is a home located in Wake County with nearby schools including Apex Elementary School, Apex Middle, and Apex High School.
Ownership History
Date
Name
Owned For
Owner Type
Purchase Details
Closed on
Dec 31, 2014
Sold by
Zielinski John A and Zielinski Kathryn A
Bought by
Cravens Mark W and Cravens Anne A
Current Estimated Value
Home Financials for this Owner
Home Financials are based on the most recent Mortgage that was taken out on this home.
Original Mortgage
$237,025
Outstanding Balance
$180,718
Interest Rate
4.03%
Mortgage Type
New Conventional
Estimated Equity
$376,629
Purchase Details
Closed on
Sep 29, 2010
Sold by
Morse Joseph L and Morse Barbara A
Bought by
Zielinski John A and Zielinski Kathryn A
Home Financials for this Owner
Home Financials are based on the most recent Mortgage that was taken out on this home.
Original Mortgage
$238,784
Interest Rate
3.3%
Mortgage Type
FHA
Create a Home Valuation Report for This Property
The Home Valuation Report is an in-depth analysis detailing your home's value as well as a comparison with similar homes in the area
Purchase History
| Date | Buyer | Sale Price | Title Company |
|---|---|---|---|
| Cravens Mark W | $249,500 | None Available | |
| Zielinski John A | $242,000 | None Available |
Source: Public Records
Mortgage History
| Date | Status | Borrower | Loan Amount |
|---|---|---|---|
| Open | Cravens Mark W | $237,025 | |
| Previous Owner | Zielinski John A | $238,784 |
Source: Public Records
Tax History
| Year | Tax Paid | Tax Assessment Tax Assessment Total Assessment is a certain percentage of the fair market value that is determined by local assessors to be the total taxable value of land and additions on the property. | Land | Improvement |
|---|---|---|---|---|
| 2025 | $4,385 | $499,962 | $200,000 | $299,962 |
| 2024 | $4,287 | $499,962 | $200,000 | $299,962 |
Source: Public Records
Map
Nearby Homes
- 1006 Lantern Light Ct
- 1200 Apache Ln
- 201 Pinewood Dr
- 1326 Apache Ln
- 1009 Charred Oak Cir
- 134 Sanair Ct
- 108 Altair Cir
- 117 Altair Cir
- 2003 Charington Ct
- 119 Heatherwood Dr
- 1005 Old Carriage Ct
- 1005 Autumnwood Cir
- 903 Norwood Ln
- 1003 Tender Dr
- 1007 Tender Dr
- 996 Tender Dr
- 630 Grand Central Station
- 345 Great Northern Station
- 1003 Lathrop Ln
- 1011 Lathrop Ln
- 1208 Eastham Dr
- 1204 Eastham Dr
- 1202 Eastham Dr
- 1205 Eastham Dr
- 1207 Eastham Dr
- 1203 Eastham Dr
- 1008 Cherokee Ct
- 1209 Eastham Dr
- 1010 Cherokee Ct
- 1212 Eastham Dr
- 1200 Eastham Dr
- 1201 Eastham Dr
- 1211 Eastham Dr
- 1308 Chimney Hill Dr
- 1402 Boxwood Ln
- 1306 Chimney Hill Dr
- 1300 Eastham Dr
- 1400 Boxwood Ln
- 1006 Cherokee Ct
- 1007 Eastham Dr
Your Personal Tour Guide
Ask me questions while you tour the home.