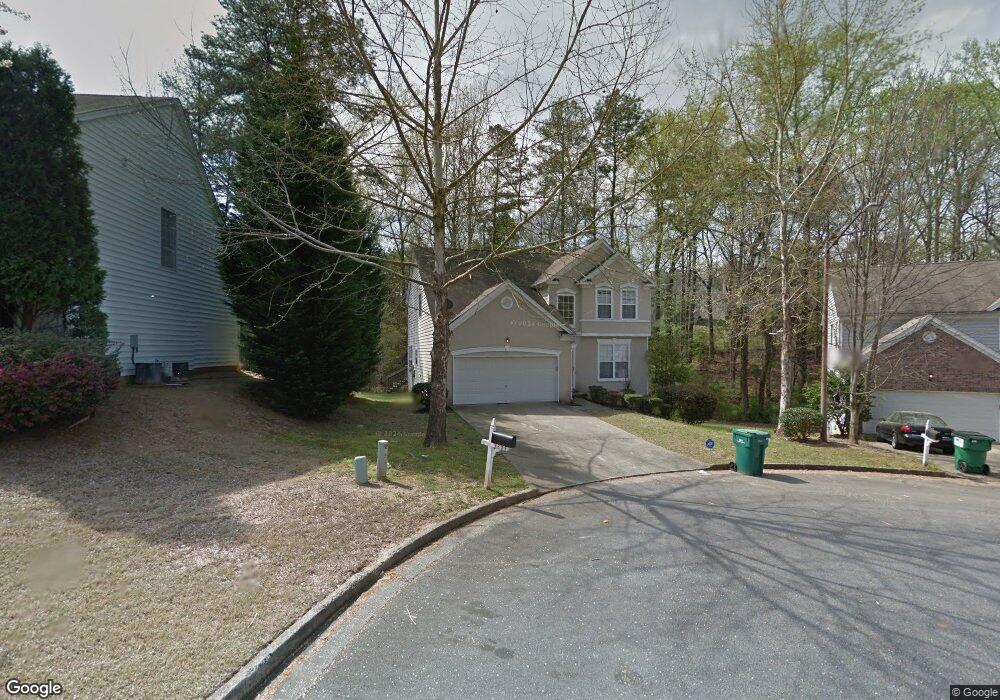
1206 Everwood Dr SW Marietta, GA 30008
Southwestern Marietta NeighborhoodEstimated Value: $408,998 - $431,000
4
Beds
3
Baths
2,661
Sq Ft
$158/Sq Ft
Est. Value
About This Home
This home is located at 1206 Everwood Dr SW, Marietta, GA 30008 and is currently estimated at $421,000, approximately $158 per square foot. 1206 Everwood Dr SW is a home located in Cobb County with nearby schools including Birney Elementary School, Smitha Middle School, and Osborne High School.
Ownership History
Date
Name
Owned For
Owner Type
Purchase Details
Closed on
Aug 12, 2011
Sold by
Secretary Of Housing And U
Bought by
Richardson Tynikia
Current Estimated Value
Home Financials for this Owner
Home Financials are based on the most recent Mortgage that was taken out on this home.
Original Mortgage
$115,544
Outstanding Balance
$78,964
Interest Rate
4.37%
Mortgage Type
FHA
Estimated Equity
$342,036
Purchase Details
Closed on
Jul 6, 2010
Sold by
Chase Hm Fin Llc
Bought by
Hud-Housing Of Urban Dev
Purchase Details
Closed on
Jul 2, 1999
Sold by
Centex Homes
Bought by
Newman Tracelyn T and Newman Michael S
Home Financials for this Owner
Home Financials are based on the most recent Mortgage that was taken out on this home.
Original Mortgage
$159,867
Interest Rate
7.43%
Mortgage Type
FHA
Create a Home Valuation Report for This Property
The Home Valuation Report is an in-depth analysis detailing your home's value as well as a comparison with similar homes in the area
Home Values in the Area
Average Home Value in this Area
Purchase History
| Date | Buyer | Sale Price | Title Company |
|---|---|---|---|
| Richardson Tynikia | $114,500 | -- | |
| Hud-Housing Of Urban Dev | -- | -- | |
| Chase Hm Fin Llc | $202,238 | -- | |
| Newman Tracelyn T | $160,000 | -- |
Source: Public Records
Mortgage History
| Date | Status | Borrower | Loan Amount |
|---|---|---|---|
| Open | Richardson Tynikia | $115,544 | |
| Previous Owner | Newman Tracelyn T | $159,867 |
Source: Public Records
Tax History Compared to Growth
Tax History
| Year | Tax Paid | Tax Assessment Tax Assessment Total Assessment is a certain percentage of the fair market value that is determined by local assessors to be the total taxable value of land and additions on the property. | Land | Improvement |
|---|---|---|---|---|
| 2025 | $5,142 | $170,672 | $30,000 | $140,672 |
| 2024 | $5,146 | $170,672 | $30,000 | $140,672 |
| 2023 | $4,277 | $141,848 | $13,600 | $128,248 |
| 2022 | $4,305 | $141,848 | $13,600 | $128,248 |
| 2021 | $2,934 | $96,664 | $13,600 | $83,064 |
| 2020 | $2,934 | $96,664 | $13,600 | $83,064 |
| 2019 | $2,533 | $83,472 | $12,000 | $71,472 |
| 2018 | $2,533 | $83,472 | $12,000 | $71,472 |
| 2017 | $2,121 | $73,780 | $12,000 | $61,780 |
| 2016 | $2,121 | $73,780 | $12,000 | $61,780 |
| 2015 | $1,349 | $45,792 | $12,232 | $33,560 |
| 2014 | $1,360 | $45,792 | $0 | $0 |
Source: Public Records
Map
Nearby Homes
- 1345 Windage Ct SW Unit 6
- 3075 Milford Chase SW
- 1308 Willamette Way
- 1086 Mornington Way
- 2615 Windage Dr SW
- 2964 Edgemont Ln SW
- 1104 Havel Dr SW
- 1105 Woodleigh Rd SW
- 2907 Crest Ridge Ct SW
- 3004 Michael Dr SW
- 3123 Milford Chase SW
- 1197 Woodleigh Rd SW
- 1020 Hicksmil Dr SW
- 1427 Lost Bridge Rd
- 2940 Caller Ct SW
- 2700 Flintlock Ln SW
- 2381 Lakeside Place SW
- 0 Everwood Dr SW Unit 7180526
- 0 Everwood Dr SW Unit 3284520
- 0 Everwood Dr SW Unit 8691355
- 0 Everwood Dr SW Unit 8620795
- 0 Everwood Dr SW Unit 8409858
- 0 Everwood Dr SW Unit 8165858
- 0 Everwood Dr SW Unit 8450904
- 0 Everwood Dr SW Unit 7281745
- 0 Everwood Dr SW Unit 7208574
- 0 Everwood Dr SW Unit 9005553
- 0 Everwood Dr SW Unit 8985478
- 0 Everwood Dr SW Unit 8788470
- 0 Everwood Dr SW Unit 7082718
- 0 Everwood Dr SW Unit 7092499
- 0 Everwood Dr SW Unit 7558251
- 1208 Everwood Dr SW
- 1204 Everwood Dr SW Unit 2/44
- 1204 Everwood Dr SW
- 1210 Everwood Dr SW
- 1202 Everwood Dr SW