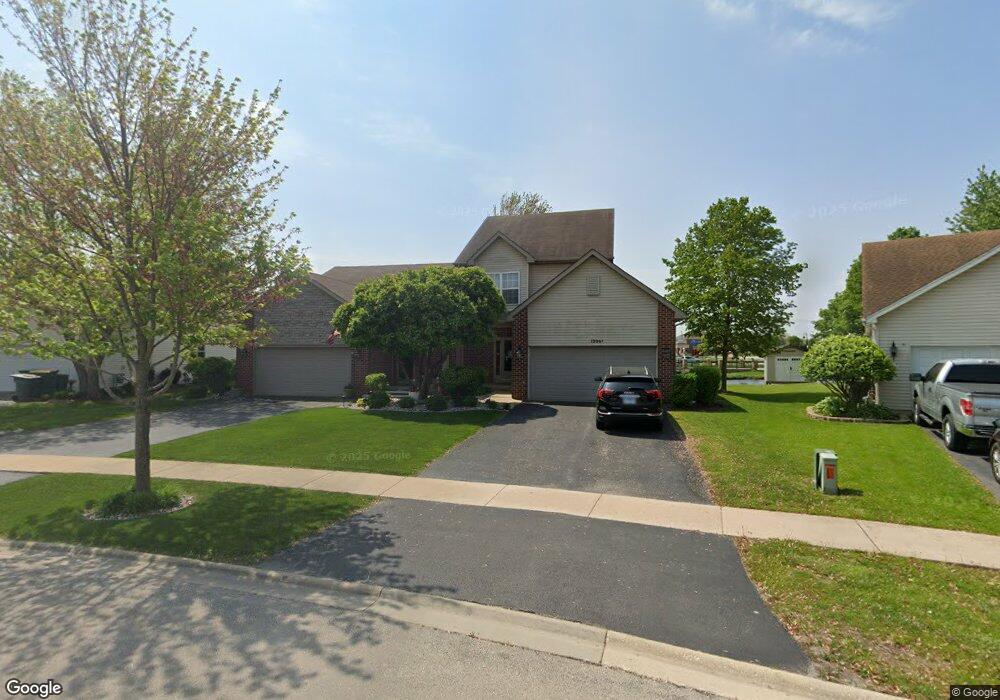
1206 Glen Mor Dr Unit A Shorewood, IL 60404
Estimated Value: $277,000 - $292,000
3
Beds
3
Baths
1,167
Sq Ft
$245/Sq Ft
Est. Value
About This Home
This home is located at 1206 Glen Mor Dr Unit A, Shorewood, IL 60404 and is currently estimated at $286,154, approximately $245 per square foot. 1206 Glen Mor Dr Unit A is a home located in Will County with nearby schools including Shorewood Elementary School, Troy Middle School, and Orenic Intermediate School.
Ownership History
Date
Name
Owned For
Owner Type
Purchase Details
Closed on
Jan 10, 2011
Sold by
Shilkus Wallace and Shilkus Janet
Bought by
Schumacher Patrick
Current Estimated Value
Purchase Details
Closed on
Aug 28, 2008
Sold by
Wilkinson William J and Wilkinson Alice R
Bought by
Shilkus Wallace and Shilkus Janet
Purchase Details
Closed on
May 5, 2004
Sold by
Jimenez Jose R and Jimenez Candida
Bought by
Wilkinson William J and Wilkinson Alice R
Purchase Details
Closed on
Nov 26, 2002
Sold by
Fox Bend Llc
Bought by
Jimenez Jose R and Jimenez Candida
Home Financials for this Owner
Home Financials are based on the most recent Mortgage that was taken out on this home.
Original Mortgage
$128,000
Interest Rate
6.25%
Mortgage Type
Purchase Money Mortgage
Purchase Details
Closed on
May 15, 2001
Sold by
First National Bank Of Joliet
Bought by
Fox Bend Llc
Create a Home Valuation Report for This Property
The Home Valuation Report is an in-depth analysis detailing your home's value as well as a comparison with similar homes in the area
Home Values in the Area
Average Home Value in this Area
Purchase History
| Date | Buyer | Sale Price | Title Company |
|---|---|---|---|
| Schumacher Patrick | $158,000 | Multiple | |
| Shilkus Wallace | $200,000 | None Available | |
| Wilkinson William J | $179,000 | Law Title | |
| Jimenez Jose R | $162,500 | Lawyers Title | |
| Fox Bend Llc | -- | -- |
Source: Public Records
Mortgage History
| Date | Status | Borrower | Loan Amount |
|---|---|---|---|
| Previous Owner | Jimenez Jose R | $128,000 |
Source: Public Records
Tax History Compared to Growth
Tax History
| Year | Tax Paid | Tax Assessment Tax Assessment Total Assessment is a certain percentage of the fair market value that is determined by local assessors to be the total taxable value of land and additions on the property. | Land | Improvement |
|---|---|---|---|---|
| 2024 | $5,795 | $78,960 | $16,554 | $62,406 |
| 2023 | $5,795 | $73,894 | $14,873 | $59,021 |
| 2022 | $5,146 | $66,269 | $14,074 | $52,195 |
| 2021 | $4,820 | $62,342 | $13,240 | $49,102 |
| 2020 | $4,857 | $62,342 | $13,240 | $49,102 |
| 2019 | $4,712 | $59,800 | $12,700 | $47,100 |
| 2018 | $4,500 | $55,950 | $12,700 | $43,250 |
| 2017 | $4,438 | $54,300 | $12,700 | $41,600 |
| 2016 | $4,303 | $51,550 | $12,700 | $38,850 |
| 2015 | $3,958 | $48,935 | $10,735 | $38,200 |
| 2014 | $3,958 | $47,738 | $10,735 | $37,003 |
| 2013 | $3,958 | $47,738 | $10,735 | $37,003 |
Source: Public Records
Map
Nearby Homes
- 1204 Glen Mor Dr Unit B
- 1228 Conquest Ct
- 1111 Country Dr
- 312 Honors Dr
- 110 National Ct
- 1728 Parkside Dr Unit 2
- 00002 Jefferson St
- 1 AC Jefferson St
- 00001 Jefferson St
- 1808 Wintercrest Ct
- 1719 Moran Dr
- 7507 Honeysuckle Ln
- 7513 Honeysuckle Ln
- 7510 Honeysuckle Ln
- 613 Rollingwood Dr
- 228 Parkside Dr
- 302 Parkside Dr
- 704 Flag Dr
- 621 Pleasant Dr
- 604 Bethany Dr
- 1206 Glen Mor Dr Unit B
- 1208 Glen Mor Dr Unit A
- 1208 Glen Mor Dr Unit B
- 1208 Glen Mor Dr
- 1208 Glen Mor #B Dr
- 1204 Glen Mor Dr Unit A
- 1210 Glen Mor Dr Unit B
- 1210 Glen Mor Dr Unit A
- 1209 Glen Mor Dr Unit A
- 1212 Glen Mor Dr Unit A
- 1212 Glen Mor Dr Unit B
- 10 N River Rd
- 200 Turnbridge Dr
- 1214 Glen Mor Dr
- 1214 Glen Mor Dr Unit A
- 1214 Glen Mor Dr Unit B
- 100 River Rd
- 1213 Glen Mor Dr
- 1216 Glen Mor Dr Unit A
- 1216 Glen Mor Dr Unit B