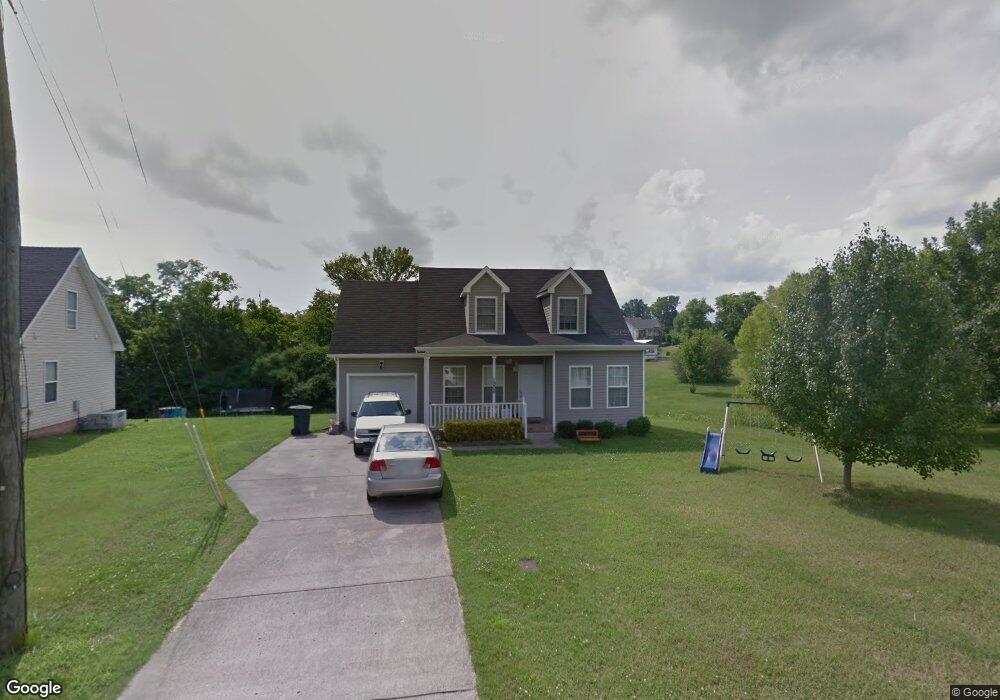
1206 Langwood Ct Gallatin, TN 37066
Estimated Value: $318,561 - $353,000
--
Bed
3
Baths
1,279
Sq Ft
$262/Sq Ft
Est. Value
About This Home
This home is located at 1206 Langwood Ct, Gallatin, TN 37066 and is currently estimated at $334,640, approximately $261 per square foot. 1206 Langwood Ct is a home located in Sumner County with nearby schools including Vena Stuart Elementary School, Rucker Stewart Middle School, and Gallatin Senior High School.
Ownership History
Date
Name
Owned For
Owner Type
Purchase Details
Closed on
Mar 12, 2019
Sold by
Charaf Kelly
Bought by
Charaf El Mostafa
Current Estimated Value
Purchase Details
Closed on
Mar 12, 2010
Sold by
Conger Henry L and Conger Vicki J
Bought by
Charaf Kelly and Charaf El Mostafa
Home Financials for this Owner
Home Financials are based on the most recent Mortgage that was taken out on this home.
Original Mortgage
$132,063
Interest Rate
5.58%
Mortgage Type
FHA
Purchase Details
Closed on
Feb 10, 2010
Sold by
Garcia Julia M
Bought by
Conger Henry L and Conger Vicki J
Home Financials for this Owner
Home Financials are based on the most recent Mortgage that was taken out on this home.
Original Mortgage
$132,063
Interest Rate
5.58%
Mortgage Type
FHA
Purchase Details
Closed on
May 24, 2006
Sold by
Garcia Julie
Bought by
Jones Charles J and Long Melissa
Purchase Details
Closed on
May 2, 2001
Sold by
Huddleston Tommy and Huddleston Peggie
Bought by
Garcia Julia
Home Financials for this Owner
Home Financials are based on the most recent Mortgage that was taken out on this home.
Original Mortgage
$117,936
Interest Rate
6.95%
Mortgage Type
FHA
Create a Home Valuation Report for This Property
The Home Valuation Report is an in-depth analysis detailing your home's value as well as a comparison with similar homes in the area
Home Values in the Area
Average Home Value in this Area
Purchase History
| Date | Buyer | Sale Price | Title Company |
|---|---|---|---|
| Charaf El Mostafa | $15,700 | None Available | |
| Charaf Kelly | $134,500 | None Available | |
| Conger Henry L | $113,700 | None Available | |
| Jones Charles J | -- | None Available | |
| Garcia Julia | $119,000 | -- |
Source: Public Records
Mortgage History
| Date | Status | Borrower | Loan Amount |
|---|---|---|---|
| Previous Owner | Charaf Kelly | $132,063 | |
| Previous Owner | Garcia Julia | $117,936 |
Source: Public Records
Tax History Compared to Growth
Tax History
| Year | Tax Paid | Tax Assessment Tax Assessment Total Assessment is a certain percentage of the fair market value that is determined by local assessors to be the total taxable value of land and additions on the property. | Land | Improvement |
|---|---|---|---|---|
| 2024 | $1,071 | $75,375 | $24,000 | $51,375 |
| 2023 | $1,584 | $51,925 | $21,750 | $30,175 |
| 2022 | $1,590 | $51,925 | $21,750 | $30,175 |
| 2021 | $1,590 | $51,925 | $21,750 | $30,175 |
| 2020 | $1,590 | $51,925 | $21,750 | $30,175 |
| 2019 | $1,590 | $0 | $0 | $0 |
| 2018 | $1,110 | $0 | $0 | $0 |
| 2017 | $1,110 | $0 | $0 | $0 |
| 2016 | $795 | $0 | $0 | $0 |
| 2015 | $1,110 | $0 | $0 | $0 |
| 2014 | $1,161 | $0 | $0 | $0 |
Source: Public Records
Map
Nearby Homes
- 1208 Langwood Dr
- 1095 Katherine St
- Caroline Plan at Windsong - Townhomes
- Roxbury Plan at Windsong - Townhomes
- Rosecliff Plan at Windsong - Townhomes
- 130 Brush Hill Ct
- 184 Primrose Ln
- 1190 Bothwell Place
- 155 Hale Ave
- 225 Drivers Ln
- 113 Primrose Ln
- 185 Stanley Dr
- Aspen Plan at The Woods
- Nantucket Plan at The Woods
- Savannah Plan at The Woods
- Alexander Plan at The Woods
- Draper Plan at The Woods
- Dalton Plan at The Woods
- Crawford Plan at The Woods
- Emery Plan at The Woods
- 1210 Langwood Ct
- 1211 Meadowview Dr
- 1202 Langwood Ct
- 1214 Langwood Ct
- 1207 Meadowview Dr
- 1209 Langwood Ct
- 1218 Langwood Ct
- 1212 Meadowview Dr
- 1211 Langwood Ct
- 306 Woodcrest Dr
- 1215 Langwood Ct
- 1222 Langwood Ct
- 1204 Meadowview Dr
- 316 Woodcrest Dr
- 316 Woodcrest Dr Unit 316
- 1200 Langwood Dr
- 310 Woodcrest Dr
- 1212 Langwood Dr
- 1196 Langwood Dr
- 314 Woodcrest Dr