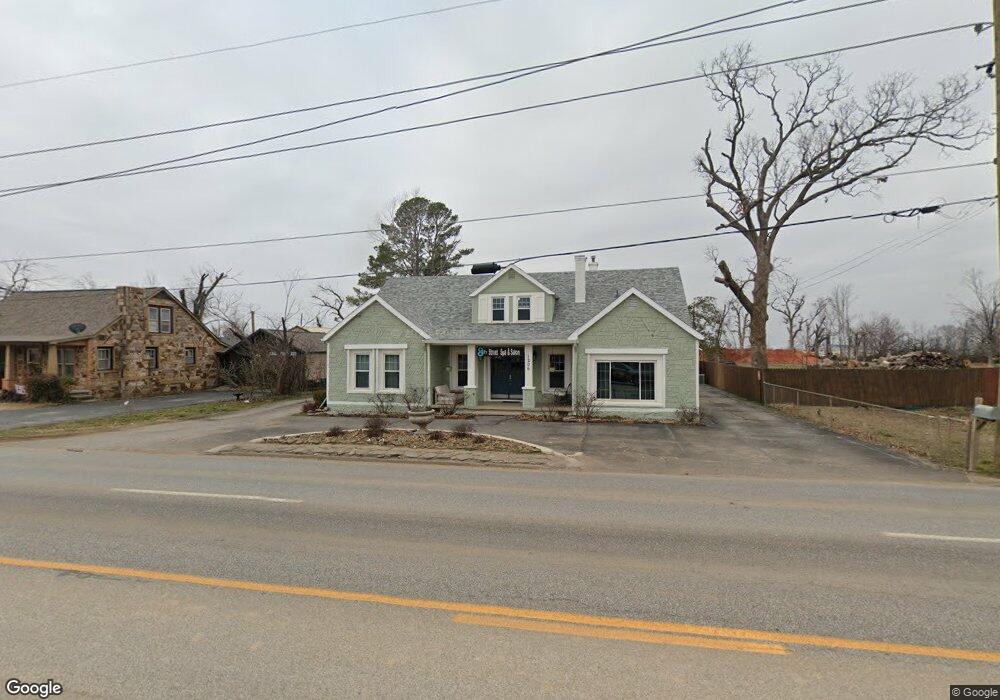
1206 N 8th St Rogers, AR 72756
Estimated Value: $403,242
--
Bed
--
Bath
300
Sq Ft
$1,344/Sq Ft
Est. Value
About This Home
This home is located at 1206 N 8th St, Rogers, AR 72756 and is currently estimated at $403,242, approximately $1,344 per square foot. 1206 N 8th St is a home located in Benton County with nearby schools including Northside Elementary School, Lingle Middle School, and Rogers Heritage High School.
Ownership History
Date
Name
Owned For
Owner Type
Purchase Details
Closed on
Mar 20, 2018
Sold by
Henley Rommy D and Henley Kimberly J
Bought by
Storms Deanna
Current Estimated Value
Home Financials for this Owner
Home Financials are based on the most recent Mortgage that was taken out on this home.
Original Mortgage
$157,250
Outstanding Balance
$113,388
Interest Rate
4.32%
Mortgage Type
Future Advance Clause Open End Mortgage
Estimated Equity
$289,854
Purchase Details
Closed on
Jun 23, 2006
Sold by
Sugg Mark C and Blair Sarah Lynn
Bought by
Henley Rommy D and Henley Kimberly J
Home Financials for this Owner
Home Financials are based on the most recent Mortgage that was taken out on this home.
Original Mortgage
$208,149
Interest Rate
6.63%
Mortgage Type
Purchase Money Mortgage
Purchase Details
Closed on
Aug 5, 2003
Bought by
Sugg and Blair
Purchase Details
Closed on
May 30, 2003
Bought by
Hultquist M
Purchase Details
Closed on
Aug 6, 1997
Bought by
Hultquist 97
Purchase Details
Closed on
Aug 11, 1989
Bought by
Clark
Create a Home Valuation Report for This Property
The Home Valuation Report is an in-depth analysis detailing your home's value as well as a comparison with similar homes in the area
Home Values in the Area
Average Home Value in this Area
Purchase History
| Date | Buyer | Sale Price | Title Company |
|---|---|---|---|
| Storms Deanna | $185,000 | None Available | |
| Henley Rommy D | -- | Lenders Title Company | |
| Sugg | $160,000 | -- | |
| Hultquist M | -- | -- | |
| Hultquist M | -- | -- | |
| Hultquist 97 | $72,000 | -- | |
| Clark | $71,000 | -- |
Source: Public Records
Mortgage History
| Date | Status | Borrower | Loan Amount |
|---|---|---|---|
| Open | Storms Deanna | $157,250 | |
| Previous Owner | Henley Rommy D | $208,149 |
Source: Public Records
Tax History Compared to Growth
Tax History
| Year | Tax Paid | Tax Assessment Tax Assessment Total Assessment is a certain percentage of the fair market value that is determined by local assessors to be the total taxable value of land and additions on the property. | Land | Improvement |
|---|---|---|---|---|
| 2025 | $3,619 | $93,678 | $25,678 | $68,000 |
| 2024 | $3,319 | $93,678 | $25,678 | $68,000 |
| 2023 | $3,107 | $58,730 | $25,680 | $33,050 |
| 2022 | $2,855 | $58,730 | $25,680 | $33,050 |
| 2021 | $2,847 | $58,730 | $25,680 | $33,050 |
| 2020 | $2,891 | $59,490 | $25,680 | $33,810 |
| 2019 | $2,891 | $59,490 | $25,680 | $33,810 |
| 2018 | $2,916 | $53,110 | $25,680 | $27,430 |
| 2017 | $2,942 | $53,110 | $25,680 | $27,430 |
| 2016 | $2,756 | $53,110 | $25,680 | $27,430 |
| 2015 | $2,393 | $53,510 | $29,160 | $24,350 |
| 2014 | $2,393 | $53,510 | $29,160 | $24,350 |
Source: Public Records
Map
Nearby Homes
- 1205 W Sunset Dr
- 1104 W Easy St
- 804 N 7th St
- 818 N 12th St
- 821 N 12th Terrace
- 1209 W Olive St
- 1014 W Olive St
- 730 N 5th St
- 709 N 6th St
- 707 N 6th St
- 510 N 8th St
- 1312 W Margaret Place
- 510 W Persimmon St
- 415 W Persimmon St
- 1413 W Bishop Dr
- AR Arkansas 12
- 918 W Maple St
- 1409 N Arkansas St
- 203 W Cedar St
- 1610 W Olive St