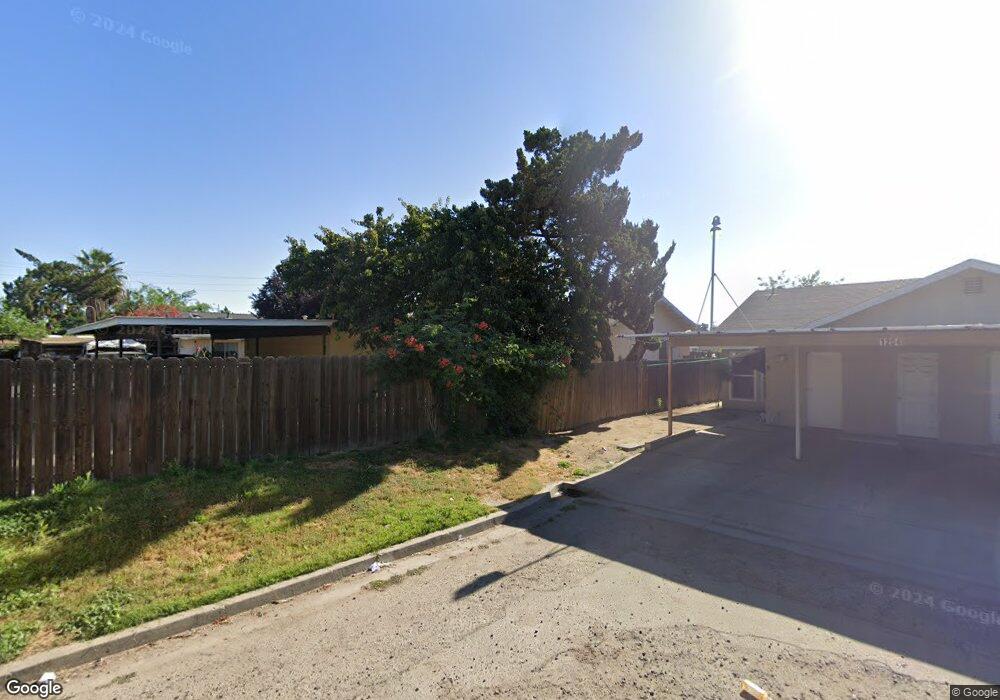
1206 N Divisadero St Unit 5-8 Visalia, CA 93291
Downtown Visalia NeighborhoodEstimated Value: $267,000 - $451,000
2
Beds
1
Bath
--
Sq Ft
0.34
Acres
About This Home
This home is located at 1206 N Divisadero St Unit 5-8, Visalia, CA 93291 and is currently estimated at $359,448. 1206 N Divisadero St Unit 5-8 is a home located in Tulare County with nearby schools including Houston Elementary School, Green Acres Middle School, and Redwood High School.
Ownership History
Date
Name
Owned For
Owner Type
Purchase Details
Closed on
Dec 23, 2015
Sold by
Laandy
Bought by
Lalivi Andy La and Livi Anne Thi Nguyen Revocable
Current Estimated Value
Purchase Details
Closed on
Apr 16, 2011
Sold by
Smith Chadwick Willard
Bought by
Laandy and Nguyen Anne
Purchase Details
Closed on
Nov 23, 2010
Sold by
Wells Fargo Bank Na
Bought by
Smith Chadwick Willard
Purchase Details
Closed on
Aug 13, 2010
Sold by
Garcia Mauricio D
Bought by
Wells Fargo Bank Na
Purchase Details
Closed on
Aug 23, 2005
Sold by
Saephan Foulin
Bought by
Garcia Mauricio D
Home Financials for this Owner
Home Financials are based on the most recent Mortgage that was taken out on this home.
Original Mortgage
$255,500
Interest Rate
5.76%
Mortgage Type
Stand Alone First
Create a Home Valuation Report for This Property
The Home Valuation Report is an in-depth analysis detailing your home's value as well as a comparison with similar homes in the area
Home Values in the Area
Average Home Value in this Area
Purchase History
| Date | Buyer | Sale Price | Title Company |
|---|---|---|---|
| Lalivi Andy La | -- | None Available | |
| Laandy | $125,000 | Chicago Title Company | |
| Smith Chadwick Willard | $127,500 | Chicago Title Company | |
| Wells Fargo Bank Na | $128,956 | Accommodation | |
| Garcia Mauricio D | $365,000 | Financial Title Company |
Source: Public Records
Mortgage History
| Date | Status | Borrower | Loan Amount |
|---|---|---|---|
| Previous Owner | Garcia Mauricio D | $255,500 |
Source: Public Records
Tax History Compared to Growth
Tax History
| Year | Tax Paid | Tax Assessment Tax Assessment Total Assessment is a certain percentage of the fair market value that is determined by local assessors to be the total taxable value of land and additions on the property. | Land | Improvement |
|---|---|---|---|---|
| 2025 | $1,704 | $160,142 | $38,433 | $121,709 |
| 2024 | $1,704 | $157,003 | $37,680 | $119,323 |
| 2023 | $1,606 | $153,926 | $36,942 | $116,984 |
| 2022 | $1,606 | $150,909 | $36,218 | $114,691 |
| 2021 | $1,606 | $147,950 | $35,508 | $112,442 |
| 2020 | $1,559 | $146,433 | $35,144 | $111,289 |
| 2019 | $1,519 | $143,562 | $34,455 | $109,107 |
| 2018 | $1,490 | $140,747 | $33,779 | $106,968 |
| 2017 | $1,465 | $137,988 | $33,117 | $104,871 |
| 2016 | $1,448 | $135,283 | $32,468 | $102,815 |
| 2015 | $1,428 | $133,251 | $31,980 | $101,271 |
| 2014 | $1,407 | $130,641 | $31,354 | $99,287 |
Source: Public Records
Map
Nearby Homes
- 915 N Rinaldi St
- 1500 W Houston Ave
- 825 N Divisadero St
- 1328 N Leslie St
- 1702 W Elowin Ave
- 2014 W Houston Ave
- 916 N Mooney Blvd
- 704 N Divisadero St
- 1200 N Jacob St
- 1933 W Buena Vista Ave
- 1722 N Mooney Blvd
- 1911 W Vine Ave
- 808 N Jacob St
- 1218 W Buena Vista Ave
- 515 N Hall St
- 2015 N Hall Ct
- 2041 N Rinaldi Ct
- 411 N Fairway St
- 1703 N Stevenson St
- 1009 W Goshen Ave
- 1206 N Divisadero St
- 1206 N Divisadero St
- 1206 N Divisadero St
- 1547 W Houston Ave
- 1215 N Rinaldi St
- 1205 N Rinaldi St
- 1607 W Houston Ave
- 1615 W Houston Ave
- 1541 W Houston Ave
- 1201 N Rinaldi St
- 1529 W Houston Ave
- 1629 W Houston Ave
- 1204 N Divisadero St Unit P & Q
- 1204 N Divisadero St Unit JKL
- 1204 N Divisadero St Unit A-C
- 1204 N Divisadero St Unit GHI
- 1204 N Divisadero St Unit R-S
- 1204 N Divisadero St Unit D,E,F
- 1204 N Divisadero St Unit m,n,o
- 1204 N Divisadero St Unit PQ RS