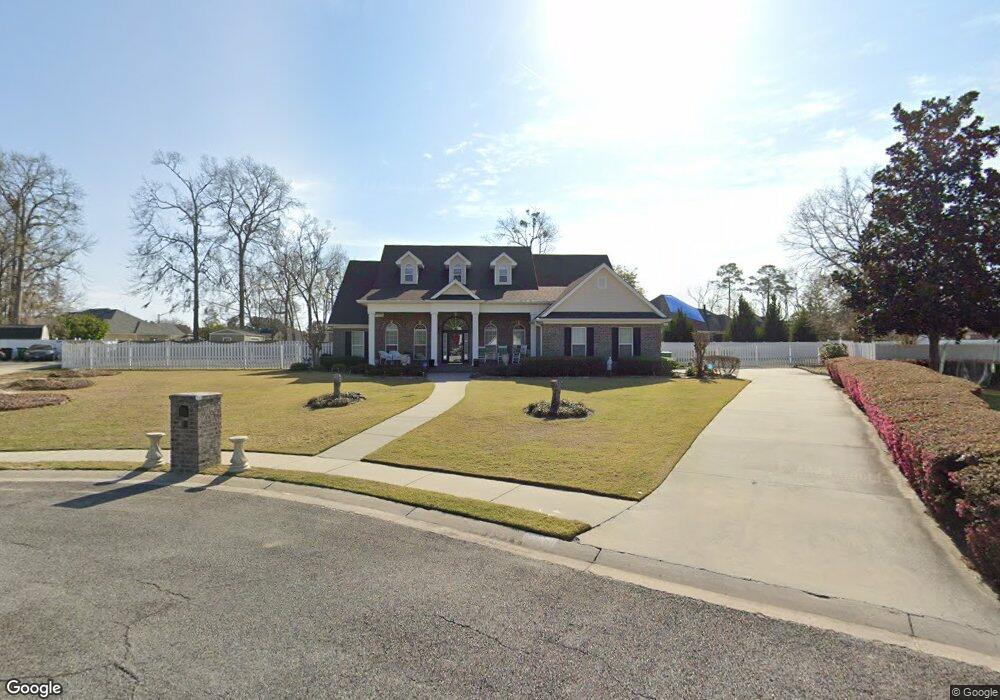
1206 Ridge Point Cir Valdosta, GA 31605
Estimated Value: $385,017 - $485,000
4
Beds
4
Baths
2,567
Sq Ft
$169/Sq Ft
Est. Value
About This Home
This home is located at 1206 Ridge Point Cir, Valdosta, GA 31605 and is currently estimated at $434,004, approximately $169 per square foot. 1206 Ridge Point Cir is a home located in Lowndes County with nearby schools including Sallas Mahone Elementary School, Valdosta Middle School, and Valdosta High School.
Ownership History
Date
Name
Owned For
Owner Type
Purchase Details
Closed on
Feb 20, 2018
Sold by
Tisdale Peggy A
Bought by
Tisdale Furman F and Trustees Of Tisdale Family Liv
Current Estimated Value
Purchase Details
Closed on
Sep 15, 2011
Sold by
Zucchi Lucille
Bought by
Tisdale Furman F and Tisdale Peggy A
Home Financials for this Owner
Home Financials are based on the most recent Mortgage that was taken out on this home.
Original Mortgage
$208,000
Interest Rate
4.24%
Mortgage Type
New Conventional
Purchase Details
Closed on
Jun 2, 2011
Sold by
Gibbs Rachael
Bought by
Zucchi Lucille and Candell Anita
Purchase Details
Closed on
May 22, 2008
Sold by
Zucchi Lucille
Bought by
Zucchi Lucille
Purchase Details
Closed on
Oct 8, 2004
Sold by
Zucchi Lucille
Bought by
Zucchi Lucille and Candell Anita
Purchase Details
Closed on
Oct 16, 2002
Sold by
Cherry Creek Properties
Bought by
Nelco Inc
Purchase Details
Closed on
Nov 29, 1994
Bought by
Cherry Creek Properties
Create a Home Valuation Report for This Property
The Home Valuation Report is an in-depth analysis detailing your home's value as well as a comparison with similar homes in the area
Home Values in the Area
Average Home Value in this Area
Purchase History
| Date | Buyer | Sale Price | Title Company |
|---|---|---|---|
| Tisdale Furman F | -- | -- | |
| Tisdale Furman F | $260,000 | -- | |
| Zucchi Lucille | -- | -- | |
| Zucchi Lucille | -- | -- | |
| Zucchi Lucille | -- | -- | |
| Zucchi Lucille | $220,000 | -- | |
| Nelco Inc | $1,216,000 | -- | |
| Cherry Creek Properties | -- | -- |
Source: Public Records
Mortgage History
| Date | Status | Borrower | Loan Amount |
|---|---|---|---|
| Previous Owner | Tisdale Furman F | $208,000 |
Source: Public Records
Tax History Compared to Growth
Tax History
| Year | Tax Paid | Tax Assessment Tax Assessment Total Assessment is a certain percentage of the fair market value that is determined by local assessors to be the total taxable value of land and additions on the property. | Land | Improvement |
|---|---|---|---|---|
| 2024 | $3,416 | $122,320 | $22,000 | $100,320 |
| 2023 | $3,416 | $122,320 | $22,000 | $100,320 |
| 2022 | $3,705 | $109,638 | $22,000 | $87,638 |
| 2021 | $3,254 | $93,586 | $22,000 | $71,586 |
| 2020 | $3,324 | $93,586 | $22,000 | $71,586 |
| 2019 | $3,322 | $93,586 | $22,000 | $71,586 |
| 2018 | $3,365 | $93,586 | $22,000 | $71,586 |
| 2017 | $3,388 | $93,586 | $22,000 | $71,586 |
| 2016 | $3,384 | $93,586 | $22,000 | $71,586 |
| 2015 | $3,332 | $100,400 | $22,000 | $78,400 |
| 2014 | $3,388 | $100,400 | $22,000 | $78,400 |
Source: Public Records
Map
Nearby Homes
- 1112 Old Meadow Rd
- 951 S Lakeshore Dr
- 729 Lake Laurie Dr
- 745 Lake Laurie Dr
- 787 Lake Laurie Dr
- 793 Lake Laurie Dr
- 5 Saint Andrews Cir
- 115 Brookview Terrace
- 3699 Arbor Run Dr
- 1144 N Lakeshore Dr
- 102 Starmount Dr
- 1148 N Lakeshore Dr
- 1156 N Lakeshore Dr
- 3557 Victoria Dr
- 3336 Plantation Dr
- 1001 Cherry Creek Dr
- 3737 Bermuda Run Dr
- 4430 Robert Dr
- 4201 Louis Dr
- 324 Jennifer Cir
- 1321 Winding Ridge Cir
- 1107 Old Meadow Rd
- 1212 Ridge Point Cir
- 1212 Ridge Pointe
- 1315 Winding Ridge Cir
- 1111 Old Meadow Rd
- 1207 Ridge Point Cir
- 1101 Old Meadow Rd
- 1307 Winding Ridge Cir
- 1318 Winding Ridge Cir
- 1106 Old Meadow Rd
- 1117 Old Meadow Rd
- 1306 Winding Ridge Cir
- 917 S Lakeshore Dr
- 1333 Winding Ridge Cir
- 1330 Winding Ridge Cir
- 1118 Old Meadow Rd
- 1100 Old Meadow Rd
- 1131 Old Meadow Rd