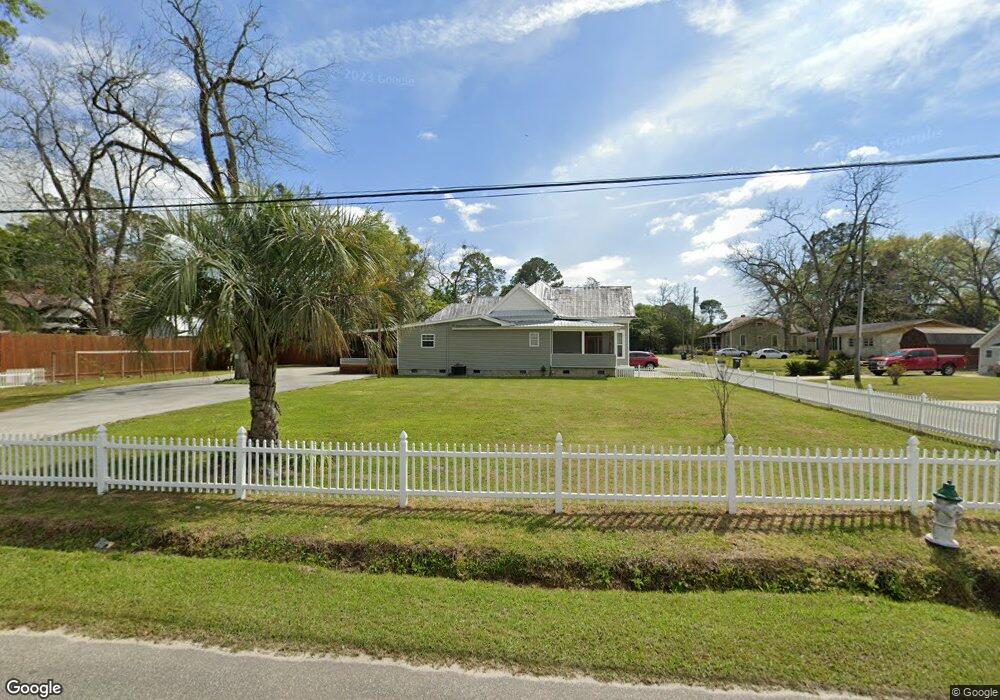
1206 S Culpepper St Quitman, GA 31643
Estimated Value: $117,000 - $166,000
3
Beds
1
Bath
1,459
Sq Ft
$96/Sq Ft
Est. Value
About This Home
This home is located at 1206 S Culpepper St, Quitman, GA 31643 and is currently estimated at $140,042, approximately $95 per square foot. 1206 S Culpepper St is a home located in Brooks County with nearby schools including Quitman Elementary School and First Baptist Church Preschool & Kindergarten.
Ownership History
Date
Name
Owned For
Owner Type
Purchase Details
Closed on
Jul 16, 2021
Sold by
Odum Binny J
Bought by
Odum Binny J and Odum Betty Sue
Current Estimated Value
Purchase Details
Closed on
Feb 21, 2018
Sold by
Odum Binny James
Bought by
Odum Binny James and Odum Betty Sue
Home Financials for this Owner
Home Financials are based on the most recent Mortgage that was taken out on this home.
Original Mortgage
$27,125
Interest Rate
4.15%
Mortgage Type
Purchase Money Mortgage
Purchase Details
Closed on
Sep 5, 2017
Sold by
Nationstar Mtg Llc
Bought by
Federal Home Loan Mortgage Corporation
Purchase Details
Closed on
Feb 3, 2012
Sold by
Goodman Richard Anthony
Bought by
Jones Lisa Lashon
Purchase Details
Closed on
May 18, 2007
Sold by
Perry Lillie Belle
Bought by
Goodman Richard A and Jones Lisa L
Purchase Details
Closed on
Jan 9, 1995
Sold by
Ealey Martha
Bought by
Ealey Mary Lou
Create a Home Valuation Report for This Property
The Home Valuation Report is an in-depth analysis detailing your home's value as well as a comparison with similar homes in the area
Home Values in the Area
Average Home Value in this Area
Purchase History
| Date | Buyer | Sale Price | Title Company |
|---|---|---|---|
| Odum Binny J | -- | -- | |
| Odum Binny James | -- | -- | |
| Odum Billy James | -- | -- | |
| Federal Home Loan Mortgage Corporation | $28,500 | -- | |
| Nationstar Mtg Llc | -- | -- | |
| Jones Lisa Lashon | -- | -- | |
| Jones Lisa Lashon | -- | -- | |
| Goodman Richard A | $62,000 | -- | |
| Ealey Mary Lou | -- | -- |
Source: Public Records
Mortgage History
| Date | Status | Borrower | Loan Amount |
|---|---|---|---|
| Previous Owner | Odum Billy James | $27,125 |
Source: Public Records
Tax History Compared to Growth
Tax History
| Year | Tax Paid | Tax Assessment Tax Assessment Total Assessment is a certain percentage of the fair market value that is determined by local assessors to be the total taxable value of land and additions on the property. | Land | Improvement |
|---|---|---|---|---|
| 2024 | -- | $59,720 | $2,920 | $56,800 |
| 2023 | $0 | $51,880 | $2,920 | $48,960 |
| 2022 | $1,393 | $39,520 | $2,840 | $36,680 |
| 2021 | $1,196 | $33,920 | $1,360 | $32,560 |
| 2020 | $1,223 | $34,680 | $1,360 | $33,320 |
| 2019 | $690 | $22,660 | $1,320 | $21,340 |
| 2018 | $824 | $22,660 | $1,320 | $21,340 |
| 2017 | $603 | $21,540 | $1,400 | $20,140 |
| 2016 | $611 | $21,980 | $1,400 | $20,580 |
| 2015 | -- | $21,740 | $1,400 | $20,340 |
| 2014 | -- | $21,740 | $1,400 | $20,340 |
| 2013 | -- | $21,740 | $1,400 | $20,340 |
Source: Public Records
Map
Nearby Homes
- 5616 Empress Rd
- 1103 W Railroad St
- 000 E Gordon St
- 802 W Lafayette St
- 309 Eastlake Dr
- 503 N Culpepper St
- 1306 E Screven St
- 804 Westlake Dr
- 606 N Court St
- 84 W Us
- 621 N Court St
- 304 W Rountree St
- 602 N Webster St
- 2434 Dunn Rd
- 1002 N Madison St
- 1540 Dunn Rd
- 7747 Empress Rd
- 714 Morris Ave
- 302 Waterside Dr
- 5036 Hamlin Rd
- 1206 S Lee St
- 1210 S Lee St
- 1207 S Washington St
- 1203 S Lee St
- 1207 S Lee St
- 1209 S Washington St
- 1201 S Washington St
- 1209 S Lee St
- 1301 S Washington St
- 1109 S Lee St
- 1103 S Washington St
- 1206 S Washington St
- 1200 S Washington St
- 426 S Lee St
- 1208 S Culpepper St
- 1305 S Lee St
- 1303 S Washington St
- 1214 S Culpepper St
- 1107 S Lee St
- 1304 S Culpepper St