Estimated Value: $287,000 - $429,000
4
Beds
3
Baths
2,752
Sq Ft
$141/Sq Ft
Est. Value
About This Home
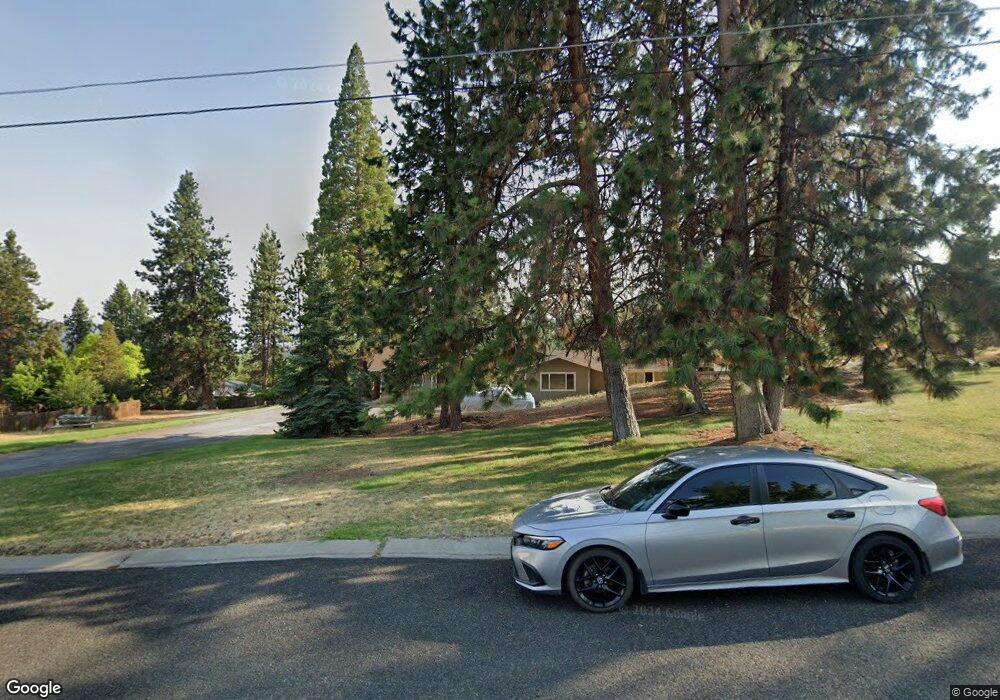
This home is located at 1207 Cedar St, Yreka, CA 96097 and is currently estimated at $388,720, approximately $141 per square foot. 1207 Cedar St is a home located in Siskiyou County with nearby schools including Evergreen Elementary School, Jackson Street Elementary School, and Yreka High School.
Ownership History
Date
Name
Owned For
Owner Type
Purchase Details
Closed on
Jul 20, 2007
Sold by
Revocabl Carlson Maryjane and Revocabl 2006 Maryjane Carlson
Bought by
Boutin Raymond J and Boutin Linda L
Current Estimated Value
Home Financials for this Owner
Home Financials are based on the most recent Mortgage that was taken out on this home.
Original Mortgage
$320,000
Interest Rate
6.73%
Mortgage Type
New Conventional
Purchase Details
Closed on
Jun 1, 2007
Sold by
Revocabl Carlson Maryjane and Revocabl 2006 Maryjane Carlson
Bought by
Revocabl Carlson Maryjane and Revocabl 2006 Maryjane Carlson
Home Financials for this Owner
Home Financials are based on the most recent Mortgage that was taken out on this home.
Original Mortgage
$320,000
Interest Rate
6.73%
Mortgage Type
New Conventional
Purchase Details
Closed on
Feb 22, 2006
Sold by
Carlson Maryjane
Bought by
Revocabl Carlson Maryjane and Revocabl 2006 Maryjane Carlson
Create a Home Valuation Report for This Property
The Home Valuation Report is an in-depth analysis detailing your home's value as well as a comparison with similar homes in the area
Home Values in the Area
Average Home Value in this Area
Purchase History
| Date | Buyer | Sale Price | Title Company |
|---|---|---|---|
| Boutin Raymond J | -- | Mt Shasta Title & Escrow Co | |
| Revocabl Carlson Maryjane | -- | Mt Shasta Title & Escrow Co | |
| Revocabl Carlson Maryjane | -- | None Available |
Source: Public Records
Mortgage History
| Date | Status | Borrower | Loan Amount |
|---|---|---|---|
| Closed | Boutin Raymond J | $320,000 |
Source: Public Records
Tax History
| Year | Tax Paid | Tax Assessment Tax Assessment Total Assessment is a certain percentage of the fair market value that is determined by local assessors to be the total taxable value of land and additions on the property. | Land | Improvement |
|---|---|---|---|---|
| 2025 | $1,666 | $169,727 | $24,860 | $144,867 |
| 2023 | $1,666 | $163,139 | $23,896 | $139,243 |
| 2022 | $1,601 | $159,941 | $23,428 | $136,513 |
| 2021 | $1,572 | $156,806 | $22,969 | $133,837 |
| 2020 | $1,561 | $155,199 | $22,734 | $132,465 |
| 2019 | $1,533 | $152,157 | $22,289 | $129,868 |
| 2018 | $1,501 | $149,174 | $21,852 | $127,322 |
| 2017 | $1,472 | $146,250 | $21,424 | $124,826 |
| 2016 | $1,436 | $143,383 | $21,004 | $122,379 |
| 2015 | $1,413 | $141,230 | $20,689 | $120,541 |
| 2014 | $1,361 | $138,464 | $20,284 | $118,180 |
Source: Public Records
Map
Nearby Homes
- 1004 Park Place
- 0 Discovery St
- 1105 North St
- 101 N Lange Way
- 908 W Miner St
- 851 Knapp St
- 754 Yama St
- 809 North St
- Parcel A + Grizzly Ct
- 109 N Fairchild St
- 151 S Dewitt Way
- 626 Acres Yreka Walker Humbug Rd
- 1130 Discovery St
- 925 W Miner St
- 816 Knapp St
- 1127 Discovery St
- 0 Hill St
- 106 N West St
- 831 Lane St
- 0 Pine St Unit 20240671
Your Personal Tour Guide
Ask me questions while you tour the home.