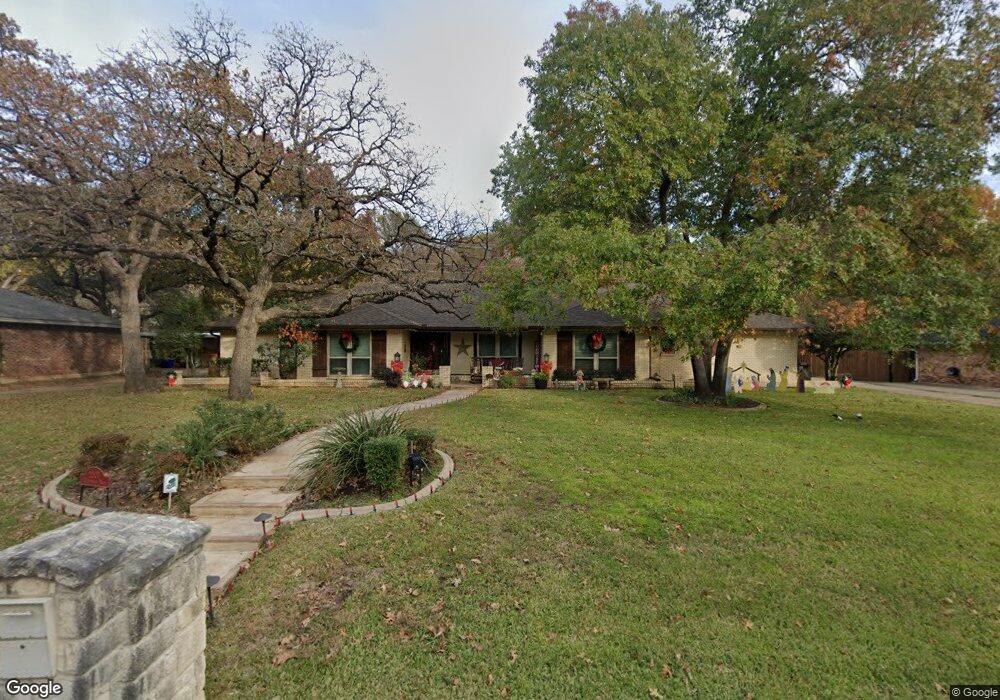
1207 Cliffwood Rd Euless, TX 76040
Estimated Value: $460,197 - $490,000
4
Beds
3
Baths
2,558
Sq Ft
$186/Sq Ft
Est. Value
About This Home
This home is located at 1207 Cliffwood Rd, Euless, TX 76040 and is currently estimated at $475,099, approximately $185 per square foot. 1207 Cliffwood Rd is a home located in Tarrant County with nearby schools including Stonegate Elementary School, Central J High School, and L.D. Bell High School.
Ownership History
Date
Name
Owned For
Owner Type
Purchase Details
Closed on
Oct 4, 2019
Sold by
Bonds Philip L and Bonds Kathy
Bought by
Langford Edward L and Collins Janna Leigh
Current Estimated Value
Home Financials for this Owner
Home Financials are based on the most recent Mortgage that was taken out on this home.
Original Mortgage
$272,000
Outstanding Balance
$238,286
Interest Rate
3.5%
Mortgage Type
New Conventional
Estimated Equity
$236,813
Purchase Details
Closed on
Jun 23, 1998
Sold by
Mccoy Shirlon B and Mccoy Romanita J
Bought by
Bonds Philip L and Bonds Kathy
Home Financials for this Owner
Home Financials are based on the most recent Mortgage that was taken out on this home.
Original Mortgage
$127,920
Interest Rate
7.13%
Purchase Details
Closed on
Jan 2, 1997
Sold by
Jenkins Jerald and Jenkins Brenda
Bought by
Mccoy Romie and Mccoy Shirlon
Create a Home Valuation Report for This Property
The Home Valuation Report is an in-depth analysis detailing your home's value as well as a comparison with similar homes in the area
Home Values in the Area
Average Home Value in this Area
Purchase History
| Date | Buyer | Sale Price | Title Company |
|---|---|---|---|
| Langford Edward L | -- | Chicago Title | |
| Bonds Philip L | -- | First American Title Co | |
| Mccoy Romie | -- | Rattikin Title Co |
Source: Public Records
Mortgage History
| Date | Status | Borrower | Loan Amount |
|---|---|---|---|
| Open | Langford Edward L | $272,000 | |
| Previous Owner | Bonds Philip L | $127,920 |
Source: Public Records
Tax History Compared to Growth
Tax History
| Year | Tax Paid | Tax Assessment Tax Assessment Total Assessment is a certain percentage of the fair market value that is determined by local assessors to be the total taxable value of land and additions on the property. | Land | Improvement |
|---|---|---|---|---|
| 2025 | $1,801 | $327,414 | $86,207 | $241,207 |
| 2024 | $1,801 | $353,707 | $112,500 | $241,207 |
| 2023 | $7,262 | $435,906 | $87,500 | $348,406 |
| 2022 | $7,545 | $351,180 | $87,500 | $263,680 |
| 2021 | $7,765 | $346,592 | $87,500 | $259,092 |
| 2020 | $7,128 | $313,857 | $87,500 | $226,357 |
| 2019 | $7,089 | $304,236 | $87,500 | $216,736 |
| 2018 | $557 | $280,262 | $50,000 | $230,262 |
| 2017 | $6,128 | $274,102 | $50,000 | $224,102 |
| 2016 | $5,571 | $231,622 | $50,000 | $181,622 |
| 2015 | $5,244 | $230,900 | $31,875 | $199,025 |
| 2014 | $5,244 | $230,900 | $31,875 | $199,025 |
Source: Public Records
Map
Nearby Homes
- 904 Nelson Terrace
- 1309 Driftwood Dr
- 1200 Tanglewood Trail
- 832 Chateau Valee Cir
- 909 Overhill Dr
- 1302 Woodridge Cir
- 921 Overhill Dr
- 1031 Boston Blvd
- 1407 Woodridge Cir
- 1604 Richmond Dr
- 1501 Woodridge Cir
- 1004 Overhill Dr
- 1613 Trinity Ct
- 933 Wade Dr
- 720 Tanglewood Dr
- 3621 Lake Hill Ln
- 716 E Pecan St Unit 716 - 722
- 704 Tanglewood Dr
- 1204 Edgecliff Dr
- 933 Charleston Ct
- 1209 Cliffwood Rd
- 1205 Cliffwood Rd
- 3911 W Pipeline Rd
- 3808 Woodvine Dr
- 1211 Cliffwood Rd
- 1206 Cliffwood Rd
- 1203 Cliffwood Rd
- 1204 Cliffwood Rd
- 1208 Cliffwood Rd
- 1202 Cliffwood Rd
- 3806 Woodvine Dr
- 3902 Woodvine Dr
- 1207 Springwood Ct
- 1205 Springwood Ct
- 1200 Cliffwood Rd
- 1201 Cliffwood Rd
- 1301 Cliffwood Rd
- 1300 Woodvine Dr
- 3903 W Pipeline Rd
- 1203 Springwood Ct