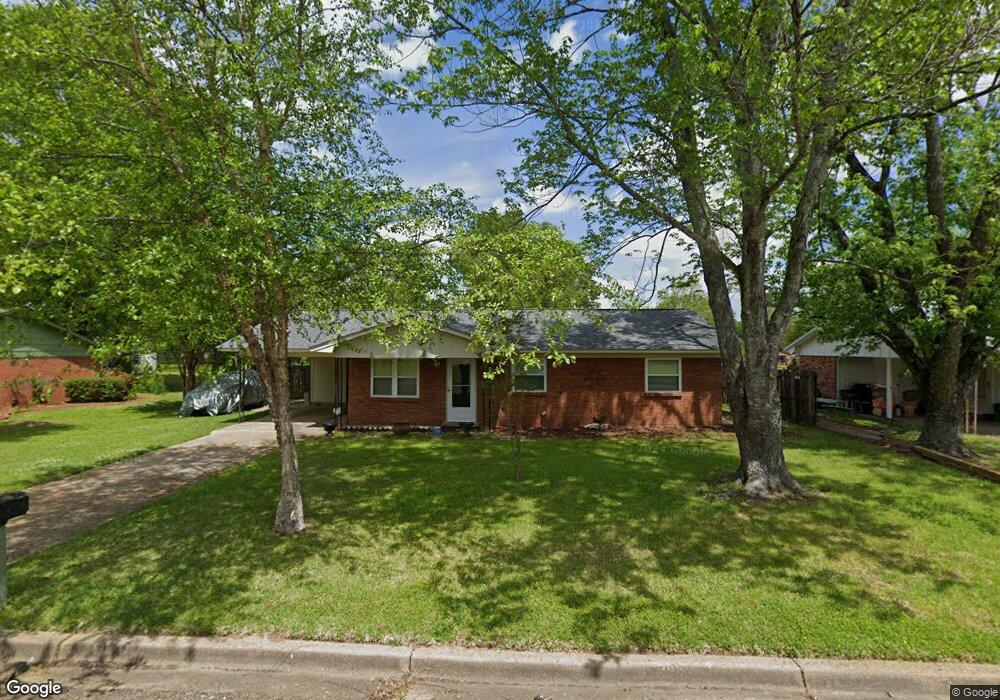
1207 Eugene St West Point, MS 39773
Estimated Value: $120,147 - $158,000
3
Beds
--
Bath
1,201
Sq Ft
$120/Sq Ft
Est. Value
About This Home
This home is located at 1207 Eugene St, West Point, MS 39773 and is currently estimated at $143,537, approximately $119 per square foot. 1207 Eugene St is a home located in Clay County with nearby schools including East Side Elementary School, West Clay Elementary School, and Church Hill Elementary School.
Ownership History
Date
Name
Owned For
Owner Type
Purchase Details
Closed on
Nov 21, 2023
Sold by
Thomas Dawn H
Bought by
Thomas Dawn H
Current Estimated Value
Purchase Details
Closed on
Jun 6, 2013
Sold by
Thomas Dawn H and Henley Linda
Bought by
Thomas Dawn H
Create a Home Valuation Report for This Property
The Home Valuation Report is an in-depth analysis detailing your home's value as well as a comparison with similar homes in the area
Purchase History
| Date | Buyer | Sale Price | Title Company |
|---|---|---|---|
| Thomas Dawn H | -- | None Listed On Document | |
| Thomas Dawn H | -- | -- |
Source: Public Records
Tax History
| Year | Tax Paid | Tax Assessment Tax Assessment Total Assessment is a certain percentage of the fair market value that is determined by local assessors to be the total taxable value of land and additions on the property. | Land | Improvement |
|---|---|---|---|---|
| 2025 | $259 | $7,551 | $1,500 | $6,051 |
| 2024 | $259 | $7,551 | $1,500 | $6,051 |
| 2023 | $705 | $6,472 | $1,500 | $4,972 |
| 2022 | $221 | $6,472 | $1,500 | $4,972 |
| 2021 | $220 | $6,472 | $1,500 | $4,972 |
| 2020 | $220 | $6,472 | $1,500 | $4,972 |
| 2019 | $201 | $6,387 | $1,500 | $4,887 |
| 2018 | $187 | $6,387 | $1,500 | $4,887 |
| 2017 | $187 | $6,387 | $1,500 | $4,887 |
| 2016 | $175 | $6,387 | $1,500 | $4,887 |
| 2015 | $171 | $5,835 | $1,500 | $4,335 |
| 2014 | $130 | $5,835 | $1,500 | $4,335 |
| 2013 | $130 | $5,835 | $1,500 | $4,335 |
Source: Public Records
Map
Nearby Homes
- 472 S Eshman Ave
- 507 S Eshman Ave
- 44 Torbert Dr
- 278 Converse Dr
- 105 Converse Dr
- 329 Converse Dr
- 405 S Eshman Ave
- 228 Mccord St
- 1046 E Brame Ave
- 913 E Westbrook St
- 341 Mccord St
- 15 David St
- 551 E Westbrook St
- 389 Mapleview Rd
- 26596 E Main St
- 27045 E Main St
- 238 Calhoun St
- 264 Mapleview Rd
- 440 Calhoun St
- 26852 E Main St
Your Personal Tour Guide
Ask me questions while you tour the home.