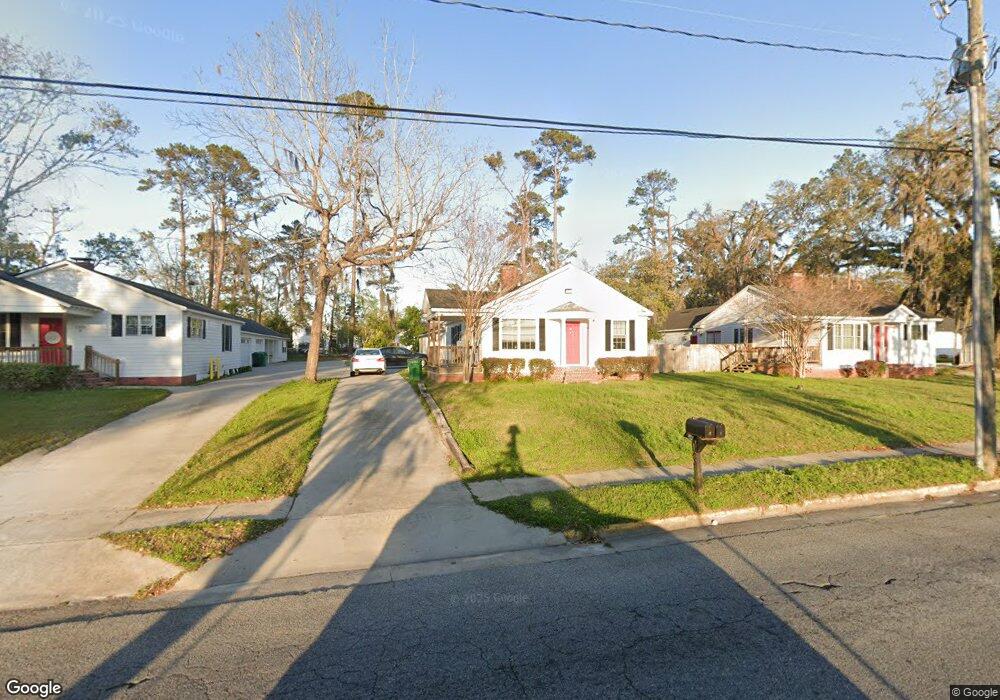
1207 N Oak St Valdosta, GA 31601
Estimated Value: $122,000 - $206,000
1
Bed
1
Bath
845
Sq Ft
$206/Sq Ft
Est. Value
About This Home
One bedroom-one bath luxury apartment. Walk to Valdosta State University. CHECK OUT THIS GREAT DECK! Perfect for studying or relaxing. Tired of noisy apartment living? Try this: quiet duplex near VSU. A real back yard!! Parking woes no more. This one has it all! Safe and secure one car enclosed garage. Chef kitchen with full size refrigerator/freezer with ice-water in the door. In-garbage disposal. Built in microwave oven-range hood. Pickled wood ceiling. Full size washer and dryer included. Georgia Power good cents energy efficient unit. Rent includes alarm service, yard service and water-sewer. You provide electric service and cable/internet. Move in today! Hurry--this one will rent fast.
Ownership History
Date
Name
Owned For
Owner Type
Purchase Details
Closed on
Dec 29, 2005
Sold by
Courson John Anthony and Courson Ellen
Bought by
D'Osta Properties Llc
Current Estimated Value
Purchase Details
Closed on
Jul 15, 2003
Sold by
Courson John Anthony
Bought by
Courson John Anthony and Courson Ellen
Purchase Details
Closed on
Oct 13, 1999
Bought by
Courson John Anthony
Purchase Details
Closed on
Dec 1, 1992
Bought by
Deming Timothy G
Purchase Details
Closed on
Oct 19, 1989
Bought by
Bescher Tristram J Etal
Create a Home Valuation Report for This Property
The Home Valuation Report is an in-depth analysis detailing your home's value as well as a comparison with similar homes in the area
Home Values in the Area
Average Home Value in this Area
Purchase History
| Date | Buyer | Sale Price | Title Company |
|---|---|---|---|
| D'Osta Properties Llc | -- | -- | |
| Courson John Anthony | -- | -- | |
| Courson John Anthony | $150,000 | -- | |
| Deming Timothy G | $39,000 | -- | |
| Bescher Tristram J Etal | $33,500 | -- |
Source: Public Records
Property History
| Date | Event | Price | List to Sale | Price per Sq Ft |
|---|---|---|---|---|
| 09/19/2017 09/19/17 | For Rent | $925 | -- | -- |
Tax History Compared to Growth
Tax History
| Year | Tax Paid | Tax Assessment Tax Assessment Total Assessment is a certain percentage of the fair market value that is determined by local assessors to be the total taxable value of land and additions on the property. | Land | Improvement |
|---|---|---|---|---|
| 2024 | $2,048 | $73,319 | $3,038 | $70,281 |
| 2023 | $2,048 | $73,319 | $3,038 | $70,281 |
| 2022 | $1,989 | $58,865 | $3,038 | $55,827 |
| 2021 | $2,047 | $58,865 | $3,038 | $55,827 |
| 2020 | $2,091 | $58,865 | $3,038 | $55,827 |
| 2019 | $2,090 | $58,865 | $3,038 | $55,827 |
| 2018 | $2,117 | $58,865 | $3,038 | $55,827 |
| 2017 | $2,131 | $58,865 | $3,038 | $55,827 |
| 2016 | $2,128 | $58,865 | $3,038 | $55,827 |
| 2015 | $1,954 | $58,865 | $3,038 | $55,827 |
| 2014 | $950 | $28,141 | $3,038 | $25,103 |
Source: Public Records
Map
Nearby Homes
- 1110 N Patterson St
- * Sustella - Green Unit 3
- 1402 Iola Dr
- 1208 N Ashley St
- 410 W Adair St
- 803 Johnson St
- 1412 N Lee St
- 808 W Adair St
- 701 Johnson St
- 311 E Adair St
- 400 E Gordon St
- 1614 N Patterson St
- 0 Canal St
- 704 3rd Ave
- 516 N Oak St
- 820 W Gordon St
- 300 Georgia Ave
- 1807 N Patterson St
- 1611 Marion St
- 625 E Brookwood Dr
- 1205 N Oak St
- 1209 N Oak St Unit A
- 1209 N Oak St
- 1211 N Oak St
- 208 W Ann St
- 208 W Ann St Unit A/B
- 1201 N Oak St
- 206 W Ann St
- 207 W Jane St
- 204 W Ann St
- 1213 N Oak St
- 1208 N Toombs St
- 1206 N Toombs St
- 1210 N Toombs St
- 1214 N Toombs St
- 1200 N Toombs St
- 1113 N Oak St
- 1301 Pinehurst Ct
- 210 W Jane St
- 205 W Ann St