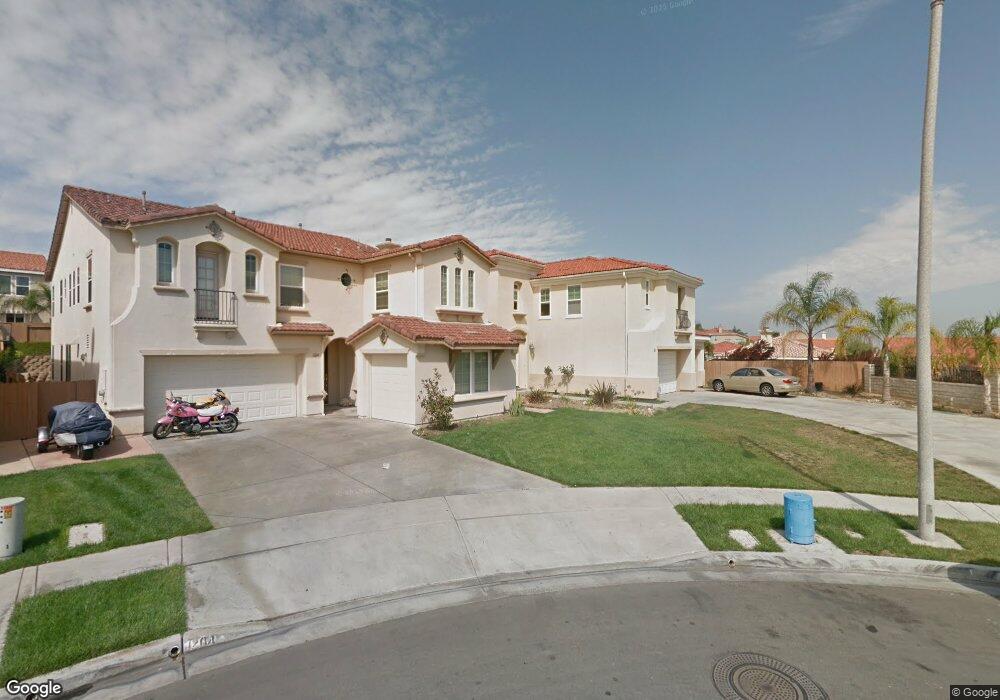
1207 Sea Robin Ct Unit 3D San Diego, CA 92154
Ocean View Hills NeighborhoodEstimated Value: $1,129,510 - $1,258,000
6
Beds
4
Baths
3,391
Sq Ft
$350/Sq Ft
Est. Value
About This Home
This home is located at 1207 Sea Robin Ct Unit 3D, San Diego, CA 92154 and is currently estimated at $1,188,128, approximately $350 per square foot. 1207 Sea Robin Ct Unit 3D is a home located in San Diego County with nearby schools including Ocean View Hills, Vista Del Mar, and San Ysidro Middle School.
Ownership History
Date
Name
Owned For
Owner Type
Purchase Details
Closed on
Oct 24, 2016
Sold by
Zeperda Javier A
Bought by
Zepeda Javier A
Current Estimated Value
Purchase Details
Closed on
Sep 1, 2006
Sold by
Zepeda Javier A
Bought by
Zepeda Javier A
Home Financials for this Owner
Home Financials are based on the most recent Mortgage that was taken out on this home.
Original Mortgage
$605,500
Outstanding Balance
$254,140
Interest Rate
1.5%
Mortgage Type
Negative Amortization
Estimated Equity
$933,988
Purchase Details
Closed on
Nov 4, 2003
Sold by
Zepeda Jayme J
Bought by
Zepeda Javier A
Purchase Details
Closed on
Aug 12, 2003
Sold by
Pardee Homes
Bought by
Zepeda Javier A
Home Financials for this Owner
Home Financials are based on the most recent Mortgage that was taken out on this home.
Original Mortgage
$267,337
Interest Rate
4.62%
Mortgage Type
Unknown
Create a Home Valuation Report for This Property
The Home Valuation Report is an in-depth analysis detailing your home's value as well as a comparison with similar homes in the area
Home Values in the Area
Average Home Value in this Area
Purchase History
| Date | Buyer | Sale Price | Title Company |
|---|---|---|---|
| Zepeda Javier A | -- | None Available | |
| Zepeda Javier A | -- | First Southwestern Title Ca | |
| Zepeda Javier A | -- | Chicago Title Co | |
| Zepeda Javier A | $502,500 | Chicago Title Co |
Source: Public Records
Mortgage History
| Date | Status | Borrower | Loan Amount |
|---|---|---|---|
| Open | Zepeda Javier A | $605,500 | |
| Previous Owner | Zepeda Javier A | $267,337 |
Source: Public Records
Tax History Compared to Growth
Tax History
| Year | Tax Paid | Tax Assessment Tax Assessment Total Assessment is a certain percentage of the fair market value that is determined by local assessors to be the total taxable value of land and additions on the property. | Land | Improvement |
|---|---|---|---|---|
| 2025 | $10,852 | $724,601 | $216,605 | $507,996 |
| 2024 | $10,852 | $710,394 | $212,358 | $498,036 |
| 2023 | $10,632 | $696,466 | $208,195 | $488,271 |
| 2022 | $10,202 | $682,811 | $204,113 | $478,698 |
| 2021 | $10,211 | $669,423 | $200,111 | $469,312 |
| 2020 | $10,037 | $662,560 | $198,060 | $464,500 |
| 2019 | $9,629 | $649,570 | $194,177 | $455,393 |
| 2018 | $9,460 | $636,834 | $190,370 | $446,464 |
| 2017 | $9,312 | $624,348 | $186,638 | $437,710 |
| 2016 | $8,763 | $590,000 | $174,000 | $416,000 |
| 2015 | $8,319 | $550,000 | $163,000 | $387,000 |
| 2014 | $7,442 | $475,000 | $141,000 | $334,000 |
Source: Public Records
Map
Nearby Homes
- 4821 Sea Water Ln
- 1166 Sea Bird Way Unit 3D
- 0 Future Airway Rd Unit Tr 1267 Lot 27
- 1568 Coporate Center Drive & Otay Mesa Rd Unit 12,13,14
- 5080 Sea Reef Place
- 5118 Mariner Dr
- 1205 Paseo Sea Cliff Unit 69
- 5361 Calle Rockfish Unit 68
- 1250 Sand Drift Point
- 5192 Emerald Cove
- 1378 Starry Way
- 1270 Paseo Sea Breeze Unit 26
- 1251 Paseo Sea Breeze Unit 17
- 5211 Calle Rockfish Unit 90
- 5405 Calle Sand Arch Unit 197
- 5360 Calle Rockfish Unit 32
- 5402 Sand Arch Ln Unit 199
- 5140 Calle Sand Arch Unit 61
- 5502 Sandcliff Ln Unit 147
- 1320 Calle Sandcliff
- 1204 Sea Robin Ct
- 1210 Sea Robin Ct
- 4823 Sea Urchin Dr
- 4813 Sea Urchin Dr
- 4833 Sea Urchin Dr
- 1172 Surf Crest Dr Unit 3D
- 4743 Sea Water Ln Unit 3D
- 4749 Sea Water Ln
- 1216 Sea Robin Ct
- 4735 Sea Water Ln Unit 3D
- 4753 Sea Water Ln Unit 3D
- 1174 Surf Crest Dr
- 4843 Sea Urchin Dr
- 4727 Sea Water Ln
- 1213 Sea Robin Ct Unit 3D
- 1222 Sea Robin Ct
- 4759 Sea Water Ln
- 1176 Surf Crest Dr Unit 3D
- 4719 Sea Water Ln Unit 3D
- 1228 Sea Robin Ct