12073 Breckenridge Rd Unit 13 Lot 39 Groveland, CA 95321
Estimated Value: $580,000 - $626,000
3
Beds
3
Baths
2,673
Sq Ft
$227/Sq Ft
Est. Value
About This Home
This home is located at 12073 Breckenridge Rd Unit 13 Lot 39, Groveland, CA 95321 and is currently estimated at $605,917, approximately $226 per square foot. 12073 Breckenridge Rd Unit 13 Lot 39 is a home located in Tuolumne County.
Ownership History
Date
Name
Owned For
Owner Type
Purchase Details
Closed on
Sep 21, 2018
Sold by
Stringari David L and Stringari Cathy F
Bought by
Mork Ovson Michele and Baker Gene R
Current Estimated Value
Home Financials for this Owner
Home Financials are based on the most recent Mortgage that was taken out on this home.
Original Mortgage
$316,000
Interest Rate
3.87%
Mortgage Type
Adjustable Rate Mortgage/ARM
Purchase Details
Closed on
Feb 5, 2018
Sold by
Strigari David L and Strigari Cathy F
Bought by
Strigari David L and Strigari Cathy F
Purchase Details
Closed on
Jun 9, 2015
Sold by
The Family Trust Of Richard Alan Masoni
Bought by
Stringari David L and Stringari Cathy F
Home Financials for this Owner
Home Financials are based on the most recent Mortgage that was taken out on this home.
Original Mortgage
$330,000
Interest Rate
3.02%
Mortgage Type
Adjustable Rate Mortgage/ARM
Purchase Details
Closed on
Jun 26, 2006
Sold by
Masoni Richard Alan and Masoni Janet Marie
Bought by
Masoni Richard Alan and Masoni Janet Marie
Create a Home Valuation Report for This Property
The Home Valuation Report is an in-depth analysis detailing your home's value as well as a comparison with similar homes in the area
Home Values in the Area
Average Home Value in this Area
Purchase History
| Date | Buyer | Sale Price | Title Company |
|---|---|---|---|
| Mork Ovson Michele | $395,000 | Fidelity National Title Co | |
| Strigari David L | -- | None Available | |
| Stringari David L | $330,000 | Yosemite Title Company | |
| Masoni Richard Alan | -- | None Available |
Source: Public Records
Mortgage History
| Date | Status | Borrower | Loan Amount |
|---|---|---|---|
| Previous Owner | Mork Ovson Michele | $316,000 | |
| Previous Owner | Stringari David L | $330,000 |
Source: Public Records
Tax History Compared to Growth
Tax History
| Year | Tax Paid | Tax Assessment Tax Assessment Total Assessment is a certain percentage of the fair market value that is determined by local assessors to be the total taxable value of land and additions on the property. | Land | Improvement |
|---|---|---|---|---|
| 2025 | $6,834 | $627,300 | $61,200 | $566,100 |
| 2024 | $6,834 | $615,000 | $60,000 | $555,000 |
| 2023 | $4,722 | $423,517 | $37,525 | $385,992 |
| 2022 | $4,632 | $415,214 | $36,790 | $378,424 |
| 2021 | $4,567 | $407,073 | $36,069 | $371,004 |
| 2020 | $4,494 | $402,900 | $35,700 | $367,200 |
| 2019 | $4,359 | $395,000 | $35,000 | $360,000 |
| 2018 | $3,843 | $348,563 | $36,967 | $311,596 |
| 2017 | $3,774 | $341,730 | $36,243 | $305,487 |
| 2016 | $3,682 | $335,031 | $35,533 | $299,498 |
| 2015 | $3,283 | $297,473 | $31,104 | $266,369 |
| 2014 | $3,209 | $291,647 | $30,495 | $261,152 |
Source: Public Records
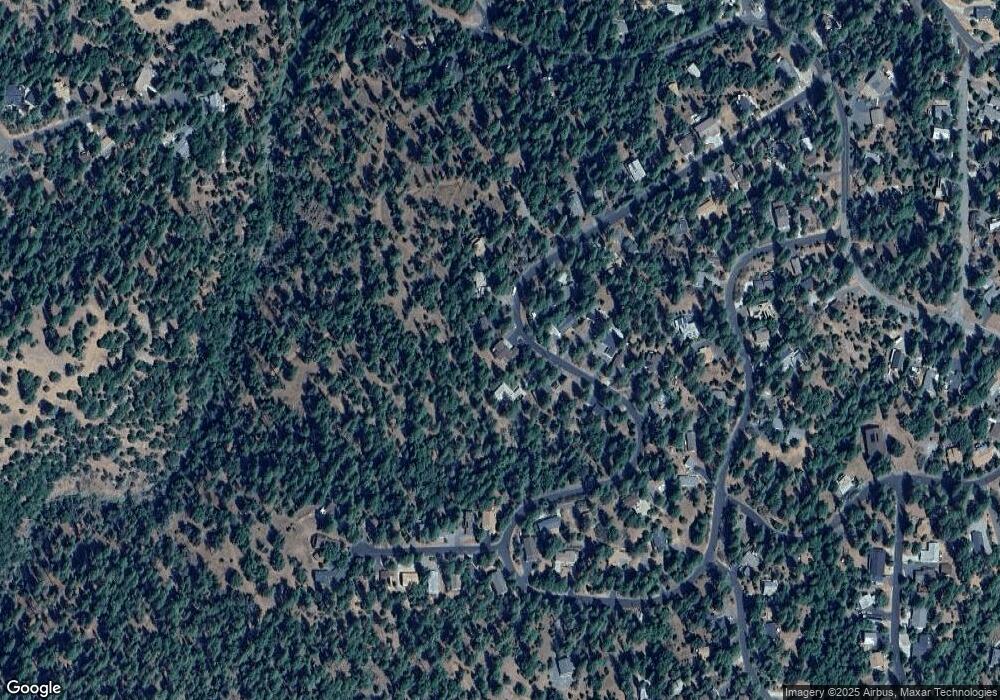
Map
Nearby Homes
- 12080 Breckenridge Rd
- 19935 Pine Mountain Dr
- 19673 Jonny Degnan Ct
- 20029 Upper Skyridge Dr Unit 15
- 20280 Little Valley Rd
- 19824 Pine Mountain Dr
- 12309 Shooting Star Ct
- 12435 Cassaretto Ct
- 19779 Pine Mountain Dr
- 20197 Upper Skyridge Dr
- 12000 Trapper Ct
- 19709 Pine Mountain Dr
- 19710 Butler Way
- 20128 Lower Skyridge Dr
- 12295 Sunnyside Way
- 12064 Hillhurst Cir
- 12073 Breckenridge Rd
- 20040 Bluebell Ct
- 12071 Breckenridge Rd Unit 13-40
- 12071 Breckenridge Rd Unit 40
- 12071 Breckenridge Rd
- 12075 Breckenridge Rd
- 12069 Breckenridge Rd
- 12078 Breckenridge Rd
- 12077 Breckenridge Rd
- 12072 Breckenridge Rd Unit 126
- 12072 Breckenridge Rd
- 12080 Breckenridge Rd Unit 128
- 12070 Breckenridge Rd Unit 125
- 12070 Breckenridge Rd
- 12065 Breckenridge Rd
- 12079 Breckenridge Rd
- 12068 Breckenridge Rd Unit 124
- 12068 Breckenridge Rd
- 12053 Breckenridge Rd
- 12053 Breckenridge Rd Unit U13L45