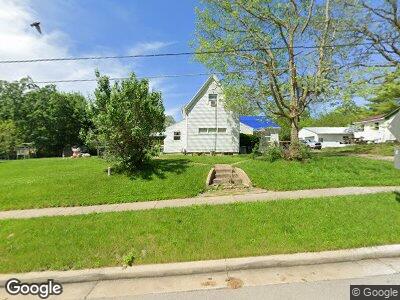
12079 New Lexington Ave Highland, OH 45132
Estimated Value: $72,000 - $153,473
4
Beds
1
Bath
1,935
Sq Ft
$63/Sq Ft
Est. Value
About This Home
This home is located at 12079 New Lexington Ave, Highland, OH 45132 and is currently estimated at $122,618, approximately $63 per square foot. 12079 New Lexington Ave is a home with nearby schools including Fairfield Local Elementary School, Fairfield Local Middle School, and Fairfield Local High School.
Ownership History
Date
Name
Owned For
Owner Type
Purchase Details
Closed on
Jun 28, 2022
Sold by
Roger Parsons
Bought by
Kibbey Brandy C
Current Estimated Value
Home Financials for this Owner
Home Financials are based on the most recent Mortgage that was taken out on this home.
Original Mortgage
$45,000
Outstanding Balance
$43,063
Interest Rate
5.1%
Mortgage Type
New Conventional
Purchase Details
Closed on
Feb 27, 2014
Sold by
Parsons Patricia A
Bought by
Parsons Roger
Purchase Details
Closed on
Aug 18, 2003
Sold by
Shiltz Neil E and Shiltz Delene
Bought by
Parsons Roger and Parsons Patricia A
Home Financials for this Owner
Home Financials are based on the most recent Mortgage that was taken out on this home.
Original Mortgage
$69,300
Interest Rate
4.45%
Mortgage Type
Purchase Money Mortgage
Purchase Details
Closed on
Jan 1, 1990
Bought by
Reis Jerald M
Create a Home Valuation Report for This Property
The Home Valuation Report is an in-depth analysis detailing your home's value as well as a comparison with similar homes in the area
Home Values in the Area
Average Home Value in this Area
Purchase History
| Date | Buyer | Sale Price | Title Company |
|---|---|---|---|
| Kibbey Brandy C | $55,000 | Thomson Douglas W | |
| Parsons Roger | -- | Attorney | |
| Parsons Roger | $77,000 | Title First Agency Inc | |
| Reis Jerald M | -- | -- |
Source: Public Records
Mortgage History
| Date | Status | Borrower | Loan Amount |
|---|---|---|---|
| Open | Kibbey Brandy C | $45,000 | |
| Previous Owner | Parsons Roger D | $55,418 | |
| Previous Owner | Parsons Roger | $69,300 |
Source: Public Records
Tax History Compared to Growth
Tax History
| Year | Tax Paid | Tax Assessment Tax Assessment Total Assessment is a certain percentage of the fair market value that is determined by local assessors to be the total taxable value of land and additions on the property. | Land | Improvement |
|---|---|---|---|---|
| 2024 | $1,597 | $25,100 | $3,080 | $22,020 |
| 2023 | $1,597 | $30,520 | $2,730 | $27,790 |
| 2022 | $2,108 | $30,520 | $2,730 | $27,790 |
| 2021 | $1,873 | $30,520 | $2,730 | $27,790 |
| 2020 | $1,768 | $24,400 | $2,170 | $22,230 |
| 2019 | $1,696 | $24,400 | $2,170 | $22,230 |
| 2018 | $1,855 | $24,400 | $2,170 | $22,230 |
| 2017 | $1,703 | $19,010 | $2,560 | $16,450 |
| 2016 | $1,699 | $19,010 | $2,560 | $16,450 |
| 2015 | $2,299 | $19,010 | $2,560 | $16,450 |
| 2014 | $1,074 | $19,010 | $2,560 | $16,450 |
| 2013 | $1,076 | $19,010 | $2,560 | $16,450 |
Source: Public Records
Map
Nearby Homes
- 12221 Antioch Rd
- 12505 Jamison Rd
- 8581 Ruby Ln
- 12785 Antioch Rd
- 0 Arch St
- 13370 Wyatt Falls Ct
- 149 Locust St
- 145 Locust St
- 144 S High St
- 417 E Main St
- 1 Pavey Rd
- 9456 Evans Rd
- 11258 Morris Rd
- 8095 Fall Creek Rd
- 44 Bernard Rd
- 400 Nordyke Rd
- 5900 Powell Rd
- 57 Kings Ct
- 0 Wright Unit 11445670
- 11380 Centerfield Rd
- 12079 New Lexington Ave
- 12087 New Lexington Ave
- 12065 New Lexington Ave
- 12103 New Lexington Ave
- 12106 New Lexington Ave
- 7864 Church
- 12107 New Lexington Ave
- 12053 New Lexington Ave
- 12111 New Lexington Ave
- 12117 New Lexington Ave
- 12123 New Lexington Ave
- 12126 New Lexington Ave
- 0 Liberty St Unit 1321707
- 12130 Horizon Ln
- 12112 New Lexington Ave
- 2893 Victory Ln
- 7918 Main St
- 0 St Rt 72 Unit 1124965
- 7934 W Main St
- 12140 New Lexington Ave