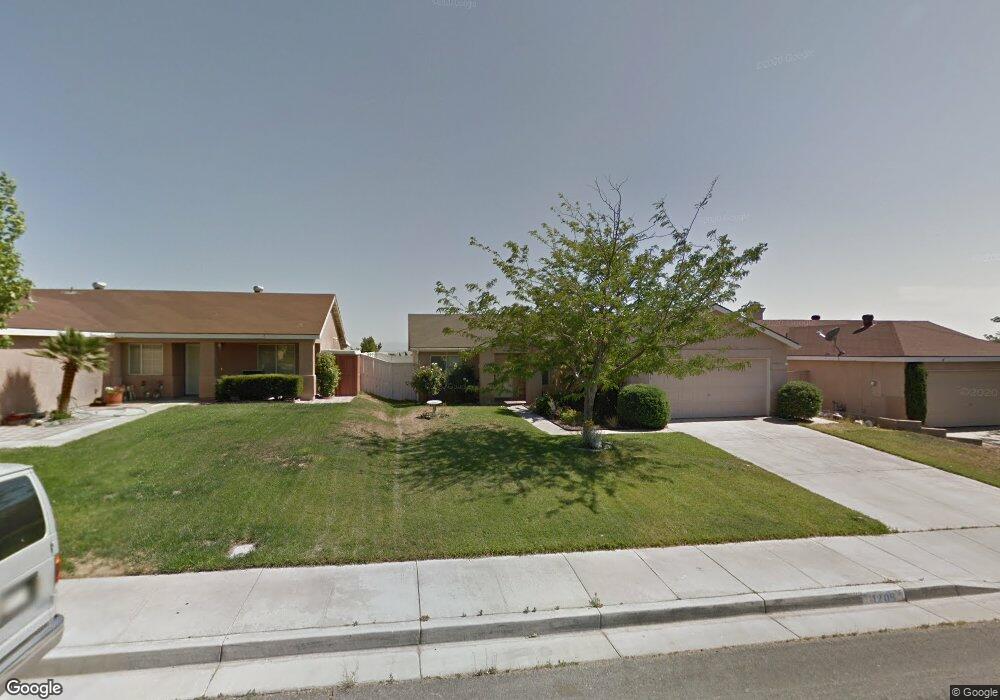
1208 Arlington Ct Rosamond, CA 93560
Estimated Value: $319,276 - $382,000
3
Beds
2
Baths
1,072
Sq Ft
$330/Sq Ft
Est. Value
About This Home
This home is located at 1208 Arlington Ct, Rosamond, CA 93560 and is currently estimated at $354,069, approximately $330 per square foot. 1208 Arlington Ct is a home located in Kern County.
Ownership History
Date
Name
Owned For
Owner Type
Purchase Details
Closed on
Jun 19, 2019
Sold by
Schultz Timothy and Schultz Lisa
Bought by
Schultz Timothy S and Schultz Lisa A
Current Estimated Value
Purchase Details
Closed on
Oct 23, 2014
Sold by
Meadowlark Management Llc
Bought by
Schultz Timothy
Purchase Details
Closed on
Mar 25, 2013
Sold by
Schultz Timothy and Schultz Lisa
Bought by
Meadowlark Management Llc
Purchase Details
Closed on
Aug 10, 2011
Sold by
Steel Ridge Llc
Bought by
Schultz Tim S
Purchase Details
Closed on
Jan 25, 2011
Sold by
Anderson Scott A and Anderson Christina E
Bought by
Steelridge Llc
Purchase Details
Closed on
Sep 2, 2004
Sold by
Johnson Thomas C
Bought by
Anderson Scott A
Home Financials for this Owner
Home Financials are based on the most recent Mortgage that was taken out on this home.
Original Mortgage
$139,200
Interest Rate
5.8%
Mortgage Type
Purchase Money Mortgage
Create a Home Valuation Report for This Property
The Home Valuation Report is an in-depth analysis detailing your home's value as well as a comparison with similar homes in the area
Home Values in the Area
Average Home Value in this Area
Purchase History
| Date | Buyer | Sale Price | Title Company |
|---|---|---|---|
| Schultz Timothy S | -- | None Available | |
| Schultz Timothy | -- | None Available | |
| Meadowlark Management Llc | $54,545 | Fidelity National Title Co | |
| Schultz Tim S | $60,000 | None Available | |
| Steelridge Llc | $55,000 | None Available | |
| Anderson Scott A | $174,000 | Alliance Title |
Source: Public Records
Mortgage History
| Date | Status | Borrower | Loan Amount |
|---|---|---|---|
| Previous Owner | Anderson Scott A | $139,200 |
Source: Public Records
Tax History Compared to Growth
Tax History
| Year | Tax Paid | Tax Assessment Tax Assessment Total Assessment is a certain percentage of the fair market value that is determined by local assessors to be the total taxable value of land and additions on the property. | Land | Improvement |
|---|---|---|---|---|
| 2025 | $2,755 | $98,502 | $24,622 | $73,880 |
| 2024 | $2,633 | $96,572 | $24,140 | $72,432 |
| 2023 | $2,633 | $94,679 | $23,667 | $71,012 |
| 2022 | $2,506 | $92,823 | $23,203 | $69,620 |
| 2021 | $2,349 | $91,004 | $22,749 | $68,255 |
| 2020 | $2,305 | $90,072 | $22,516 | $67,556 |
| 2019 | $1,410 | $90,072 | $22,516 | $67,556 |
| 2018 | $1,375 | $86,577 | $21,643 | $64,934 |
| 2017 | $1,355 | $84,880 | $21,219 | $63,661 |
| 2016 | $1,303 | $83,216 | $20,803 | $62,413 |
| 2015 | $1,561 | $81,967 | $20,491 | $61,476 |
| 2014 | $1,936 | $80,362 | $20,090 | $60,272 |
Source: Public Records
Map
Nearby Homes
- 1156 Arlington Ct
- 3724 Juniper Ridge Ln
- 1148 Wrightwood Ct
- 1016 Armstrong Ave
- 3756 Juniper Ridge Ln
- 1149 Wrightwood Ct
- 1208 Oakwood Ln
- 0 Vic United St & Barrington Ave Unit 25001991
- 3533 Fernwood St
- 1009 Heatherfield Ave
- 3300 15th St W Unit 361
- 3300 15th St W Unit 182
- 3300 15th St W Unit 194
- 3300 15th St W Unit 39
- 3300 15th St W Unit Spc 230
- 3300 15th St W Unit 355
- 3300 15th St W Unit 272
- 3300 15th St W Unit Spc 59
- 3300 15th St W Unit 340
- 1040 Fairwind Ave
- 1200 Arlington Ct
- 3757 Lyons Dr
- 1164 Arlington Ct
- 3756 Scherer Dr
- 3749 Lyons Dr
- 3765 Lyons Dr
- 1209 Arlington Ct
- 1217 Arlington Ct
- 1201 Arlington Ct
- 3748 Scherer Dr
- 3749 Scherer Dr
- 1165 Arlington Ct
- 3801 Scherer Dr
- 3741 Lyons Dr
- 3809 Scherer Dr
- 3741 Scherer Dr
- 3756 Lyons Dr
- 3740 Scherer Dr
- 1157 Arlington Ct
- 3733 Lyons Dr