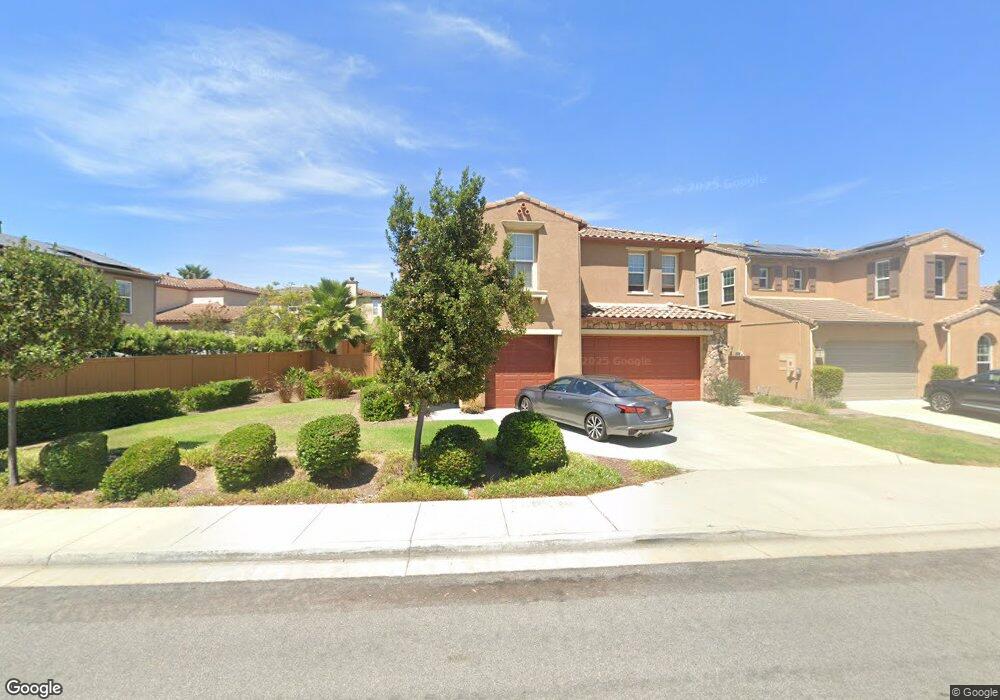
1208 Breakaway Dr Oceanside, CA 92057
North Valley NeighborhoodEstimated Value: $1,110,848 - $1,289,000
3
Beds
3
Baths
3,080
Sq Ft
$380/Sq Ft
Est. Value
About This Home
This home is located at 1208 Breakaway Dr, Oceanside, CA 92057 and is currently estimated at $1,170,212, approximately $379 per square foot. 1208 Breakaway Dr is a home located in San Diego County with nearby schools including Bonsall West Elementary School, Sullivan Middle School, and Bonsall High.
Ownership History
Date
Name
Owned For
Owner Type
Purchase Details
Closed on
Jun 13, 2017
Sold by
Logan Joseph P and Logan Minako
Bought by
Logan Joseph and Logan Minako
Current Estimated Value
Purchase Details
Closed on
Aug 1, 2013
Sold by
Logan Joseph P
Bought by
Logan Joseph P and Logan Minako
Home Financials for this Owner
Home Financials are based on the most recent Mortgage that was taken out on this home.
Original Mortgage
$363,500
Outstanding Balance
$269,130
Interest Rate
4.28%
Mortgage Type
New Conventional
Estimated Equity
$901,082
Purchase Details
Closed on
Nov 17, 2010
Sold by
Kuniyoshi Minako
Bought by
Logan Joseph P
Home Financials for this Owner
Home Financials are based on the most recent Mortgage that was taken out on this home.
Original Mortgage
$374,674
Interest Rate
4.17%
Mortgage Type
New Conventional
Purchase Details
Closed on
Oct 27, 2010
Sold by
Hearthstone Multi Asset Entity B Lp
Bought by
Logan Joseph P
Home Financials for this Owner
Home Financials are based on the most recent Mortgage that was taken out on this home.
Original Mortgage
$374,674
Interest Rate
4.17%
Mortgage Type
New Conventional
Create a Home Valuation Report for This Property
The Home Valuation Report is an in-depth analysis detailing your home's value as well as a comparison with similar homes in the area
Home Values in the Area
Average Home Value in this Area
Purchase History
| Date | Buyer | Sale Price | Title Company |
|---|---|---|---|
| Logan Joseph | -- | None Available | |
| Logan Joseph P | -- | First American Title Insuran | |
| Logan Joseph P | -- | First American Title Ins Co | |
| Logan Joseph P | $468,500 | First American Title |
Source: Public Records
Mortgage History
| Date | Status | Borrower | Loan Amount |
|---|---|---|---|
| Open | Logan Joseph P | $363,500 | |
| Closed | Logan Joseph P | $374,674 |
Source: Public Records
Tax History
| Year | Tax Paid | Tax Assessment Tax Assessment Total Assessment is a certain percentage of the fair market value that is determined by local assessors to be the total taxable value of land and additions on the property. | Land | Improvement |
|---|---|---|---|---|
| 2025 | $8,494 | $600,019 | $204,984 | $395,035 |
| 2024 | $8,494 | $588,255 | $200,965 | $387,290 |
| 2023 | $8,313 | $576,722 | $197,025 | $379,697 |
| 2022 | $8,207 | $565,414 | $193,162 | $372,252 |
| 2021 | $8,098 | $554,328 | $189,375 | $364,953 |
| 2020 | $8,051 | $548,645 | $187,434 | $361,211 |
| 2019 | $7,868 | $537,888 | $183,759 | $354,129 |
| 2018 | $7,892 | $527,342 | $180,156 | $347,186 |
| 2017 | $8,022 | $517,003 | $176,624 | $340,379 |
| 2016 | $7,939 | $506,866 | $173,161 | $333,705 |
| 2015 | $7,870 | $499,253 | $170,560 | $328,693 |
| 2014 | $7,856 | $489,474 | $167,219 | $322,255 |
Source: Public Records
Map
Nearby Homes
- 1241 Breakaway Dr
- 1141 Parkview Dr
- 1061 Boulder Place
- 1120 Championship Rd
- 1247 Bellingham Dr
- 1039 Eliot St
- 1113 Teal Way
- 5450 Alexandrine Ct
- 0 Wilshire Rd
- 1447 Puritan Dr
- 290 Hadley Way
- 1486 Puritan Way
- 868 Panella Ct
- 1438 Salem Ct
- 276 Paxton Way
- 1479 Puritan Dr
- 5168 Indian Ct
- 5164 Indian Ct
- 1477 Salem Ct
- 662 Michael St
- 1206 Lookout Ave
- 1210 Lookout Ave
- 1214 Lookout Ave
- 1216 Breakaway Dr
- 1289 Breakaway Dr
- 1285 Breakaway Dr
- 1281 Breakaway Dr
- 1277 Breakaway Dr
- 1273 Breakaway Dr
- 1205 Lookout Ave
- 1209 Lookout Ave
- 1269 Breakaway Dr
- 1017 Breakaway Dr
- 1021 Breakaway Dr
- 1013 Breakaway Dr
- 1025 Breakaway Dr
- 1213 Lookout Ave
- 1265 Breakaway Dr
- 1009 Breakaway Dr
- 1029 Breakaway Dr
Your Personal Tour Guide
Ask me questions while you tour the home.