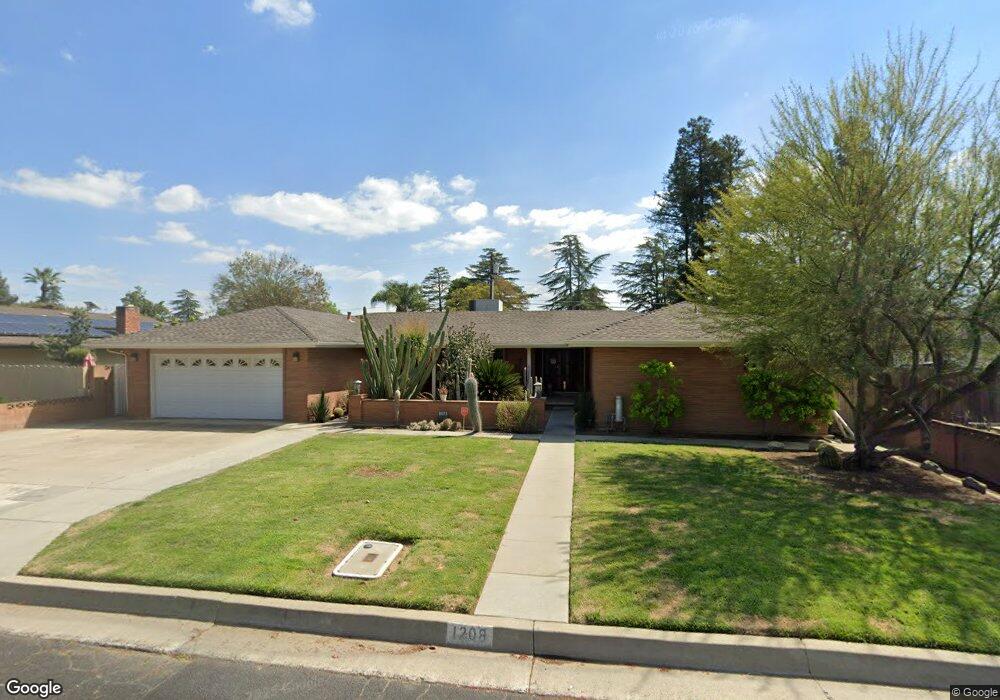
1208 de Cesari Ave Madera, CA 93637
West Madera NeighborhoodEstimated Value: $455,000 - $531,000
3
Beds
3
Baths
2,474
Sq Ft
$202/Sq Ft
Est. Value
About This Home
This home is located at 1208 de Cesari Ave, Madera, CA 93637 and is currently estimated at $498,588, approximately $201 per square foot. 1208 de Cesari Ave is a home located in Madera County with nearby schools including John Adams Elementary School, Thomas Jefferson Middle School, and Madera High School.
Ownership History
Date
Name
Owned For
Owner Type
Purchase Details
Closed on
Jan 26, 2009
Sold by
Garcia James H and Garcia Arlene F
Bought by
Bavery Vern A and Bavery Patricia D
Current Estimated Value
Home Financials for this Owner
Home Financials are based on the most recent Mortgage that was taken out on this home.
Original Mortgage
$192,351
Outstanding Balance
$121,459
Interest Rate
5.08%
Mortgage Type
FHA
Estimated Equity
$377,129
Purchase Details
Closed on
Jan 10, 2006
Sold by
Garcia James H and Garcia Arlene F
Bought by
Garcia James H and Garcia Arlene F
Purchase Details
Closed on
Aug 13, 1999
Sold by
Alexander Sterling M and Alexander Sandra M
Bought by
Garcia James H and Garcia Arlene F
Home Financials for this Owner
Home Financials are based on the most recent Mortgage that was taken out on this home.
Original Mortgage
$110,000
Interest Rate
8.09%
Mortgage Type
Stand Alone First
Create a Home Valuation Report for This Property
The Home Valuation Report is an in-depth analysis detailing your home's value as well as a comparison with similar homes in the area
Home Values in the Area
Average Home Value in this Area
Purchase History
| Date | Buyer | Sale Price | Title Company |
|---|---|---|---|
| Bavery Vern A | $196,000 | Chicago Title Company | |
| Garcia James H | -- | None Available | |
| Garcia James H | $140,000 | Chicago Title Co |
Source: Public Records
Mortgage History
| Date | Status | Borrower | Loan Amount |
|---|---|---|---|
| Open | Bavery Vern A | $192,351 | |
| Previous Owner | Garcia James H | $110,000 |
Source: Public Records
Tax History
| Year | Tax Paid | Tax Assessment Tax Assessment Total Assessment is a certain percentage of the fair market value that is determined by local assessors to be the total taxable value of land and additions on the property. | Land | Improvement |
|---|---|---|---|---|
| 2025 | $2,860 | $252,256 | $77,258 | $174,998 |
| 2023 | $2,860 | $242,462 | $74,259 | $168,203 |
| 2022 | $2,670 | $237,708 | $72,803 | $164,905 |
| 2021 | $2,619 | $233,048 | $71,376 | $161,672 |
| 2020 | $2,666 | $230,660 | $70,645 | $160,015 |
| 2019 | $2,494 | $213,464 | $65,636 | $147,828 |
| 2018 | $2,346 | $213,464 | $65,636 | $147,828 |
| 2017 | $2,250 | $203,299 | $62,510 | $140,789 |
| 2016 | $2,193 | $199,312 | $61,284 | $138,028 |
| 2015 | $2,142 | $195,535 | $61,223 | $134,312 |
| 2014 | $1,865 | $179,390 | $56,168 | $123,222 |
Source: Public Records
Map
Nearby Homes
- 157 N Park Dr
- 1237 de Cesari Ave
- 174 N Park Dr
- 991 Baylor Ct
- 716 Willis Ave
- 1632 University Ave
- 1637 Princeton Ave
- 430 Rotan Ave
- 815 W Yosemite Ave
- 724 W Yosemite Ave
- Avenue 23
- 15707 Road 22 1 2
- 820 Columbia St
- 1803 Sunset Ave
- 817 Sierra St
- 313 S K St
- 300 S Gateway Dr
- 930 Sierra St
- 363 E Rush St
- 0 N A St
- 1212 de Cesari Ave
- 400 California Ave
- 151 N Park Dr
- 149 N Park Dr
- 1216 de Cesari Ave
- 153 N Park Dr
- 1209 de Cesari Ave
- 1205 de Cesari Ave
- 1213 de Cesari Ave
- 1220 de Cesari Ave
- 155 N Park Dr
- 401 California Ave
- 1217 de Cesari Ave
- 405 California Ave
- 145 N Park Dr
- 1201 de Cesari Ave
- 1221 de Cesari Ave
- 1224 de Cesari Ave
- 409 California Ave
- 150 N Park Dr
Your Personal Tour Guide
Ask me questions while you tour the home.