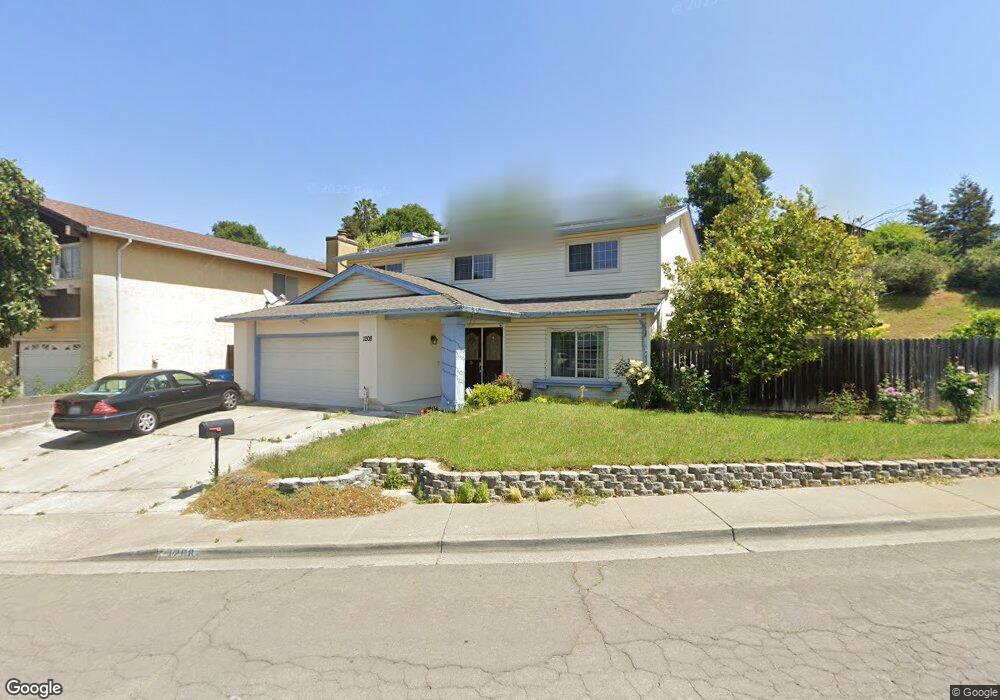
1208 Devlin Dr Vallejo, CA 94591
Estimated Value: $591,000 - $688,000
4
Beds
3
Baths
2,117
Sq Ft
$303/Sq Ft
Est. Value
About This Home
This home is located at 1208 Devlin Dr, Vallejo, CA 94591 and is currently estimated at $640,772, approximately $302 per square foot. 1208 Devlin Dr is a home located in Solano County with nearby schools including Annie Pennycook Elementary School, Hogan Middle School, and Jesse M. Bethel High School.
Ownership History
Date
Name
Owned For
Owner Type
Purchase Details
Closed on
Dec 30, 1998
Sold by
Edwards William G and Edwards Gail Crabtree
Bought by
Tabaranza Romeo R and Tabaranza Nenita
Current Estimated Value
Home Financials for this Owner
Home Financials are based on the most recent Mortgage that was taken out on this home.
Original Mortgage
$191,207
Outstanding Balance
$44,235
Interest Rate
6.73%
Mortgage Type
FHA
Estimated Equity
$596,537
Purchase Details
Closed on
Aug 27, 1998
Sold by
Boying Sioson
Bought by
Edwards William G and Edwards Gail Crabtree
Purchase Details
Closed on
Feb 11, 1998
Sold by
Edwards William G and Edwards Gail Crabtree
Bought by
Sioson Boying and Sioson Marison
Purchase Details
Closed on
Jun 23, 1997
Sold by
Boying Sioson and Edwards William G
Bought by
Edwards William G and Edwards Gail Crabtree
Create a Home Valuation Report for This Property
The Home Valuation Report is an in-depth analysis detailing your home's value as well as a comparison with similar homes in the area
Purchase History
| Date | Buyer | Sale Price | Title Company |
|---|---|---|---|
| Tabaranza Romeo R | $192,500 | Frontier Title Company | |
| Edwards William G | $6,233 | -- | |
| Sioson Boying | -- | -- | |
| Edwards William G | $43,700 | -- |
Source: Public Records
Mortgage History
| Date | Status | Borrower | Loan Amount |
|---|---|---|---|
| Open | Tabaranza Romeo R | $191,207 |
Source: Public Records
Tax History
| Year | Tax Paid | Tax Assessment Tax Assessment Total Assessment is a certain percentage of the fair market value that is determined by local assessors to be the total taxable value of land and additions on the property. | Land | Improvement |
|---|---|---|---|---|
| 2025 | $4,574 | $301,776 | $78,380 | $223,396 |
| 2024 | $4,574 | $295,860 | $76,844 | $219,016 |
| 2023 | $4,312 | $290,060 | $75,338 | $214,722 |
| 2022 | $4,217 | $284,373 | $73,861 | $210,512 |
| 2021 | $4,124 | $278,798 | $72,413 | $206,385 |
| 2020 | $4,141 | $275,940 | $71,671 | $204,269 |
| 2019 | $4,017 | $270,530 | $70,266 | $200,264 |
| 2018 | $3,764 | $265,227 | $68,889 | $196,338 |
| 2017 | $3,599 | $260,028 | $67,539 | $192,489 |
| 2016 | $3,028 | $254,930 | $66,215 | $188,715 |
| 2015 | $2,989 | $251,102 | $65,221 | $185,881 |
| 2014 | $2,947 | $246,184 | $63,944 | $182,240 |
Source: Public Records
Map
Nearby Homes
- 1466 Granada St
- 112 Aragon Ct
- 108 Sunnyglen Dr
- 479 Aragon St
- 709 Pope Dr
- 150 Yorkshire Ct
- 185 Lexington Dr
- 116 Greeves St
- 8601 Rockaway Dr
- 8707 Aquamarine Dr
- 8620 Rockaway Dr
- 223 Toledo Ct
- 8632 Rockaway Dr
- 235 Toledo Ct
- 159 Coleridge Dr
- 414 Brunswick Dr
- 111 Elgin Ct
- 501 Baywood Dr
- 236 Corkwood St
- 148 Haggerty St
- 1212 Devlin Dr
- 1204 Devlin Dr
- 1415 Granada Ct
- 1417 Granada Ct
- 1216 Devlin Dr
- 1420 Greenmont Dr
- 1211 Devlin Dr
- 1407 Granada St
- 1213 Devlin Dr
- 1205 Devlin Dr
- 1413 Granada Ct
- 1401 Granada St
- 1218 Devlin Dr
- 1419 Granada Ct
- 1215 Devlin Dr
- 1410 Greenmont Dr
- 1411 Greenmont Dr
- 1393 Granada St
- 1421 Granada Ct
- 385 Barcelona St
Your Personal Tour Guide
Ask me questions while you tour the home.