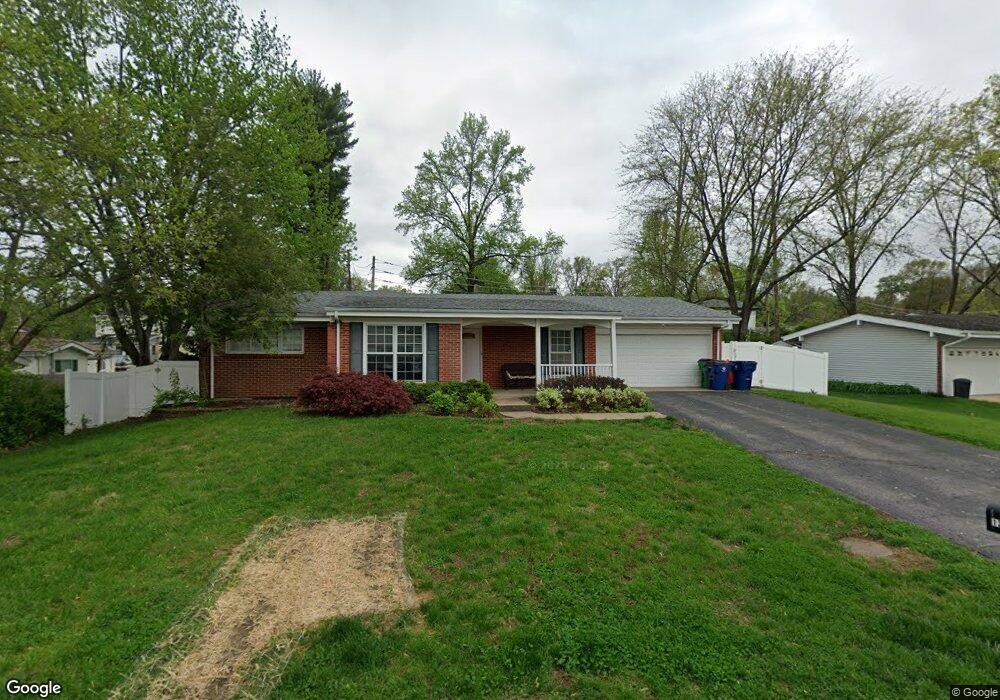
1208 Moncoeur Dr Saint Louis, MO 63146
Estimated Value: $317,000 - $362,000
3
Beds
2
Baths
1,865
Sq Ft
$182/Sq Ft
Est. Value
About This Home
This home is located at 1208 Moncoeur Dr, Saint Louis, MO 63146 and is currently estimated at $339,416, approximately $181 per square foot. 1208 Moncoeur Dr is a home located in St. Louis County with nearby schools including Craig Elementary School, Parkway Northeast Middle School, and Parkway North High School.
Ownership History
Date
Name
Owned For
Owner Type
Purchase Details
Closed on
Jul 22, 2011
Sold by
Office Forms Inc
Bought by
Kaenter Daniel
Current Estimated Value
Purchase Details
Closed on
Mar 21, 2008
Sold by
Kaenter Daniel J
Bought by
Office Forms Inc
Purchase Details
Closed on
Sep 30, 2003
Sold by
Haefner Kurt S and Haefner Lisa M
Bought by
Kaenter Daniel J
Home Financials for this Owner
Home Financials are based on the most recent Mortgage that was taken out on this home.
Original Mortgage
$153,600
Interest Rate
5.62%
Mortgage Type
Unknown
Purchase Details
Closed on
Jun 26, 2000
Sold by
Richerson Rex A and Richerson Michelle R
Bought by
Haefner Kurt S and Haefner Lisa M
Home Financials for this Owner
Home Financials are based on the most recent Mortgage that was taken out on this home.
Original Mortgage
$134,900
Interest Rate
8.66%
Create a Home Valuation Report for This Property
The Home Valuation Report is an in-depth analysis detailing your home's value as well as a comparison with similar homes in the area
Home Values in the Area
Average Home Value in this Area
Purchase History
| Date | Buyer | Sale Price | Title Company |
|---|---|---|---|
| Kaenter Daniel | -- | None Available | |
| Office Forms Inc | -- | None Available | |
| Kaenter Daniel J | $192,000 | -- | |
| Haefner Kurt S | $149,900 | -- |
Source: Public Records
Mortgage History
| Date | Status | Borrower | Loan Amount |
|---|---|---|---|
| Previous Owner | Kaenter Daniel J | $153,600 | |
| Previous Owner | Haefner Kurt S | $134,900 |
Source: Public Records
Tax History Compared to Growth
Tax History
| Year | Tax Paid | Tax Assessment Tax Assessment Total Assessment is a certain percentage of the fair market value that is determined by local assessors to be the total taxable value of land and additions on the property. | Land | Improvement |
|---|---|---|---|---|
| 2025 | $3,723 | $57,090 | $32,220 | $24,870 |
| 2024 | $3,723 | $56,870 | $21,490 | $35,380 |
| 2023 | $3,675 | $56,870 | $21,490 | $35,380 |
| 2022 | $3,464 | $48,850 | $25,080 | $23,770 |
| 2021 | $3,439 | $48,850 | $25,080 | $23,770 |
| 2020 | $3,407 | $46,220 | $23,670 | $22,550 |
| 2019 | $3,354 | $46,220 | $23,670 | $22,550 |
| 2018 | $2,855 | $36,270 | $17,900 | $18,370 |
| 2017 | $2,834 | $36,270 | $17,900 | $18,370 |
| 2016 | $2,757 | $33,550 | $9,840 | $23,710 |
| 2015 | $2,874 | $33,550 | $9,840 | $23,710 |
| 2014 | $2,520 | $31,410 | $7,770 | $23,640 |
Source: Public Records
Map
Nearby Homes
- 44 Riviera Ct
- 11993 Moorland Manor Ct
- 1407 Summerhaven Dr
- 11017 Sandistan Dr
- 1425 Craig Rd
- 11861 Spruce Orchard Dr
- 12045 Bridal Shire Ct
- 814 Mary Meadows Ln
- 842 N New Ballas Ct Unit 302
- 950 E Rue de La Banque Unit 202
- 950 E Rue de La Banque Unit L1
- 950 E Rue de La Banque Unit 208
- 950 E Rue de La Banque Unit 317
- 950 E Rue de La Banque Unit 118
- 866 Deaver Ln
- 1060 Port Diane Dr
- 18 Sona Ln
- 2 Wedgewood Ln
- 1033 Mackinac Dr
- 648 Coeur de Royale Dr Unit B
- 1216 Moncoeur Dr
- 1200 Moncoeur Dr
- 1211 Bardot Ln
- 11311 Trieste Dr
- 1215 Moncoeur Dr
- 11317 Trieste Dr
- 1207 Moncoeur Dr
- 11301 Trieste Dr
- 1220 Moncoeur Dr
- 1235 Bardot Ln
- 11323 Trieste Dr
- 1241 Moncoeur Dr
- 1224 Moncoeur Dr
- 1249 Bardot Ln
- 1210 Bardot Ln
- 1226 Bardot Ln
- 1232 Moncoeur Dr
- 11329 Trieste Dr
- 11312 Trieste Dr
- 11306 Trieste Dr