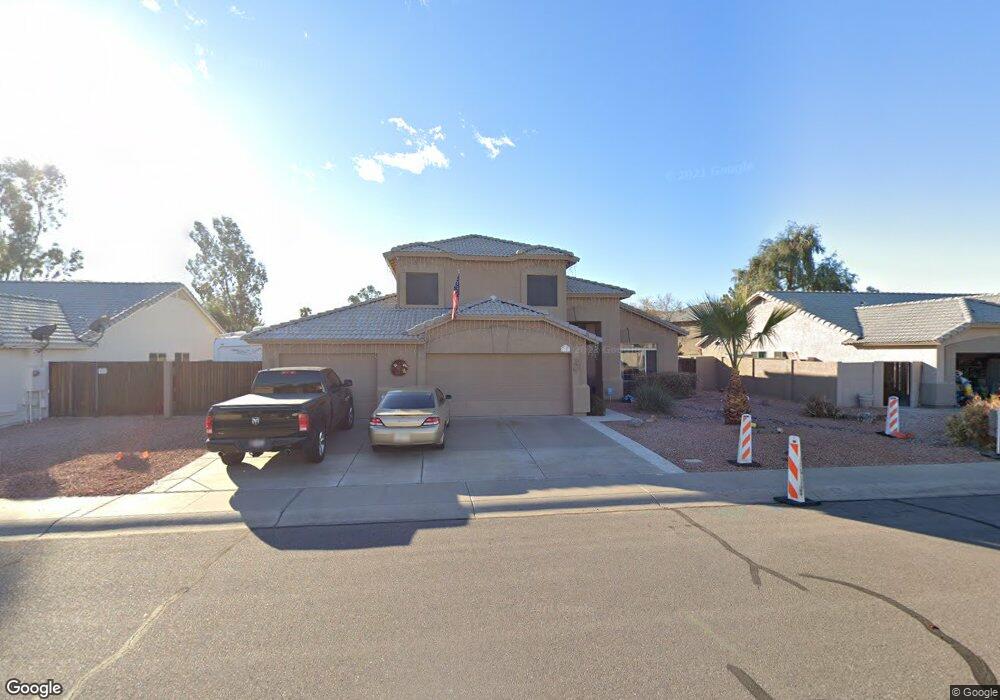
1208 N Velero St Chandler, AZ 85225
The Islands NeighborhoodEstimated Value: $528,841 - $637,000
--
Bed
4
Baths
2,316
Sq Ft
$260/Sq Ft
Est. Value
About This Home
This home is located at 1208 N Velero St, Chandler, AZ 85225 and is currently estimated at $601,710, approximately $259 per square foot. 1208 N Velero St is a home located in Maricopa County with nearby schools including Shumway Elementary School, Willis Junior High School, and Chandler High School.
Ownership History
Date
Name
Owned For
Owner Type
Purchase Details
Closed on
Feb 8, 2002
Sold by
Pangaldan Robert F
Bought by
Keesee Pangaldan Deanna L
Current Estimated Value
Purchase Details
Closed on
Jun 30, 1999
Sold by
Winchell Vern Harry and Winchell Christine Elizabeth
Bought by
Winchell Ii Vern Harry and Winchell Christine Elizabeth
Purchase Details
Closed on
Jun 23, 1999
Sold by
Roth Werner and Roth Thelma
Bought by
Keesee Deanna L and Wood William W
Purchase Details
Closed on
Dec 17, 1997
Sold by
Briggs Lloyd G and Briggs Maureen S
Bought by
Roth Werner and Roth Thelma J
Home Financials for this Owner
Home Financials are based on the most recent Mortgage that was taken out on this home.
Original Mortgage
$131,000
Interest Rate
6.97%
Mortgage Type
New Conventional
Purchase Details
Closed on
Jan 12, 1997
Sold by
Hfs Mobility Services Inc
Bought by
Briggs Lloyd G and Briggs Maureen S
Create a Home Valuation Report for This Property
The Home Valuation Report is an in-depth analysis detailing your home's value as well as a comparison with similar homes in the area
Home Values in the Area
Average Home Value in this Area
Purchase History
| Date | Buyer | Sale Price | Title Company |
|---|---|---|---|
| Keesee Pangaldan Deanna L | -- | First American Title | |
| Keesee Pangaldan Deanna L | -- | First American Title | |
| Winchell Ii Vern Harry | -- | -- | |
| Keesee Deanna L | $172,000 | Chicago Title Insurance Co | |
| Roth Werner | $164,000 | Fidelity Title | |
| Briggs Lloyd G | -- | Fidelity Title |
Source: Public Records
Mortgage History
| Date | Status | Borrower | Loan Amount |
|---|---|---|---|
| Previous Owner | Roth Werner | $131,000 |
Source: Public Records
Tax History Compared to Growth
Tax History
| Year | Tax Paid | Tax Assessment Tax Assessment Total Assessment is a certain percentage of the fair market value that is determined by local assessors to be the total taxable value of land and additions on the property. | Land | Improvement |
|---|---|---|---|---|
| 2025 | $2,216 | $28,446 | -- | -- |
| 2024 | $2,140 | $27,092 | -- | -- |
| 2023 | $2,140 | $43,730 | $8,740 | $34,990 |
| 2022 | $2,065 | $32,370 | $6,470 | $25,900 |
| 2021 | $2,165 | $31,160 | $6,230 | $24,930 |
| 2020 | $2,155 | $29,220 | $5,840 | $23,380 |
| 2019 | $2,072 | $26,250 | $5,250 | $21,000 |
| 2018 | $2,007 | $24,860 | $4,970 | $19,890 |
| 2017 | $1,870 | $23,270 | $4,650 | $18,620 |
| 2016 | $1,802 | $21,880 | $4,370 | $17,510 |
| 2015 | $1,746 | $21,700 | $4,340 | $17,360 |
Source: Public Records
Map
Nearby Homes
- 1126 N Melody Cir
- 1691 E Gary Dr
- 1951 E Baylor Ct
- 938 W Iris Dr
- 941 N Adams Ct
- 1214 W Iris Dr
- 1853 E Shannon St
- 1302 N Bedford Dr
- 861 W Shellfish Dr
- 1590 E Robinson Way
- 916 S Dolphin Dr
- 791 N Velero St
- 920 W Grand Caymen Dr
- 643 W Devon Ct
- 1014 E Golden Ct
- 1135 W Sea Fog Dr
- 1818 S Saddle St
- 919 S Paradise Dr Unit III
- 745 W Ivanhoe St
- 715 W Stottler Place
- 1212 N Velero St
- 1204 N Velero St
- 1205 N Cambridge Cir
- 1209 N Cambridge Cir
- 1201 N Cambridge Cir
- 1207 N Velero St
- 1216 N Velero St
- 1211 N Velero St
- 1203 N Velero St
- 1215 N Velero St
- 1212 N Cambridge Cir
- 1220 N Tower Ave
- 1642 E Gail Dr
- 1652 E Gail Dr
- 1219 N Velero St
- 1541 E Sheffield Ave
- 1230 N Tower Ave
- 1210 N Tower Ave
- 1537 E Sheffield Ave
- 1191 N Cambridge St