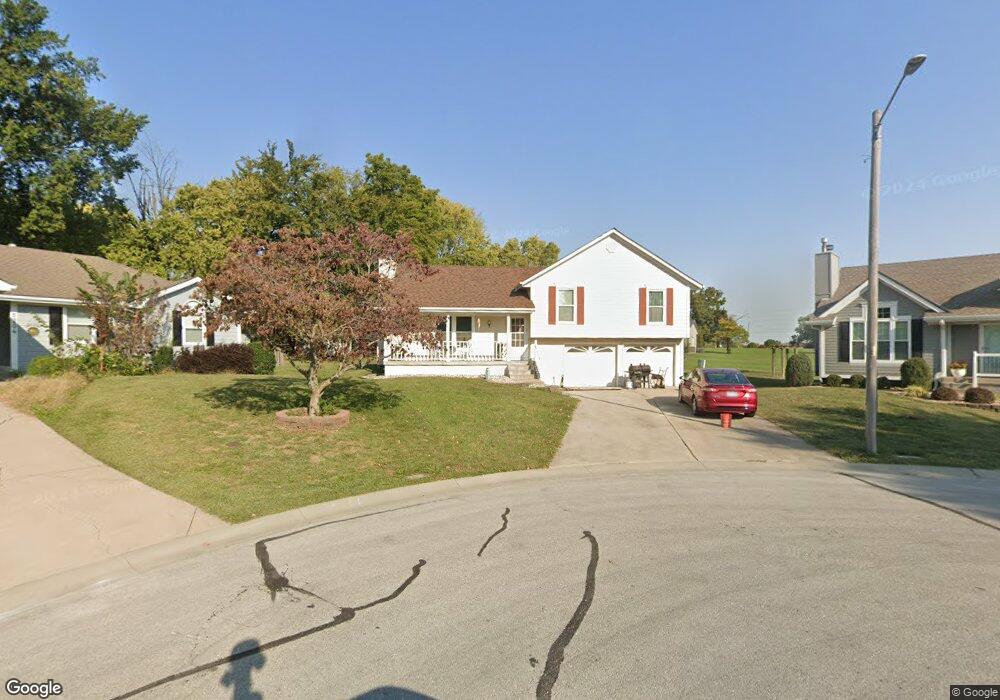
1208 NE Bryant Cir Lees Summit, MO 64086
Estimated Value: $289,902 - $319,000
3
Beds
2
Baths
1,178
Sq Ft
$256/Sq Ft
Est. Value
About This Home
This home is located at 1208 NE Bryant Cir, Lees Summit, MO 64086 and is currently estimated at $301,226, approximately $255 per square foot. 1208 NE Bryant Cir is a home located in Jackson County with nearby schools including Underwood Elementary School, Bernard C. Campbell Middle School, and Lee's Summit North High School.
Ownership History
Date
Name
Owned For
Owner Type
Purchase Details
Closed on
May 10, 2024
Sold by
Legacy Home Ventures Llc and Executive Acquisitions Llc
Bought by
Dressen Chad
Current Estimated Value
Home Financials for this Owner
Home Financials are based on the most recent Mortgage that was taken out on this home.
Original Mortgage
$195,000
Outstanding Balance
$192,219
Interest Rate
6.79%
Mortgage Type
New Conventional
Estimated Equity
$109,007
Purchase Details
Closed on
Mar 26, 2024
Sold by
Legacy Home Ventures Llc
Bought by
Legacy Home Ventures Llc and Executive Acquisitions Llc
Home Financials for this Owner
Home Financials are based on the most recent Mortgage that was taken out on this home.
Original Mortgage
$195,000
Outstanding Balance
$192,219
Interest Rate
6.79%
Mortgage Type
New Conventional
Estimated Equity
$109,007
Purchase Details
Closed on
Jun 1, 2015
Sold by
Long Orville Dennis and Long Sherry R
Bought by
La Salle Fsb Orville D and Long Sherry R
Create a Home Valuation Report for This Property
The Home Valuation Report is an in-depth analysis detailing your home's value as well as a comparison with similar homes in the area
Home Values in the Area
Average Home Value in this Area
Purchase History
| Date | Buyer | Sale Price | Title Company |
|---|---|---|---|
| Dressen Chad | -- | None Listed On Document | |
| Dressen Chad | -- | None Listed On Document | |
| Legacy Home Ventures Llc | -- | None Listed On Document | |
| Legacy Home Ventures Llc | -- | None Listed On Document | |
| La Salle Fsb Orville D | -- | None Available |
Source: Public Records
Mortgage History
| Date | Status | Borrower | Loan Amount |
|---|---|---|---|
| Open | Dressen Chad | $195,000 | |
| Closed | Dressen Chad | $195,000 | |
| Previous Owner | Legacy Home Ventures Llc | $158,250 |
Source: Public Records
Tax History
| Year | Tax Paid | Tax Assessment Tax Assessment Total Assessment is a certain percentage of the fair market value that is determined by local assessors to be the total taxable value of land and additions on the property. | Land | Improvement |
|---|---|---|---|---|
| 2025 | $3,948 | $38,445 | $7,625 | $30,820 |
| 2024 | $3,948 | $54,674 | $9,314 | $45,360 |
| 2023 | $3,919 | $54,674 | $8,248 | $46,426 |
| 2022 | $2,347 | $29,070 | $5,871 | $23,199 |
| 2021 | $2,395 | $29,070 | $5,871 | $23,199 |
| 2020 | $2,303 | $27,674 | $5,871 | $21,803 |
| 2019 | $2,240 | $27,674 | $5,871 | $21,803 |
| 2018 | $2,306 | $26,446 | $3,610 | $22,836 |
| 2017 | $2,306 | $26,446 | $3,610 | $22,836 |
| 2016 | $2,272 | $25,783 | $4,313 | $21,470 |
| 2014 | $2,183 | $24,290 | $4,038 | $20,252 |
Source: Public Records
Map
Nearby Homes
- 1104 NE Country Ln
- 1700 NE Bluff St
- 1708 NE Bluff St
- 1704 NE Bluff St
- 1616 NE Bluff St
- 905 NE Country Ln
- 1029 NE Brookfield Dr
- 1028 NE Brookfield Dr
- 1118 NE Deerbrook Terrace
- 1213 NE Ball Dr
- 1000 NE Brookfield Dr
- 1345 NE Foxwood Dr
- 1541 NE Neawanna Dr
- 1829 NE Riley Dr
- 1013 NE Ravenwood Terrace
- 1030 NE Todd George Rd
- 1133 NE Mulberry St
- 1138 NE Mulberry St
- 616 NE Michael Dr
- 617 NE Birchwood Dr
- 1204 NE Bryant Cir
- 1209 NE Bryant Cir
- 1200 NE Bryant Cir
- 1205 NE Bryant Cir
- 1508 NE Savoy
- 1205 NE Hendrix Dr
- 1209 NE Hendrix Dr
- 1214 NE Colleen Ct
- 1201 NE Hendrix Dr
- 1213 NE Hendrix Dr
- 1216 NE Colleen Ct
- 1512 NE Savoy
- 1212 NE Colleen Ct
- 1124 NE Bryant Dr
- 1217 NE Hendrix Dr
- 1125 NE Bryant Dr
- 1501 NE Tudor Rd
- 1218 NE Colleen Ct
- 1125 NE Hendrix Dr
- 1208 NE Colleen Dr
Your Personal Tour Guide
Ask me questions while you tour the home.