Estimated Value: $372,506 - $443,000
2
Beds
3
Baths
1,567
Sq Ft
$266/Sq Ft
Est. Value
About This Home
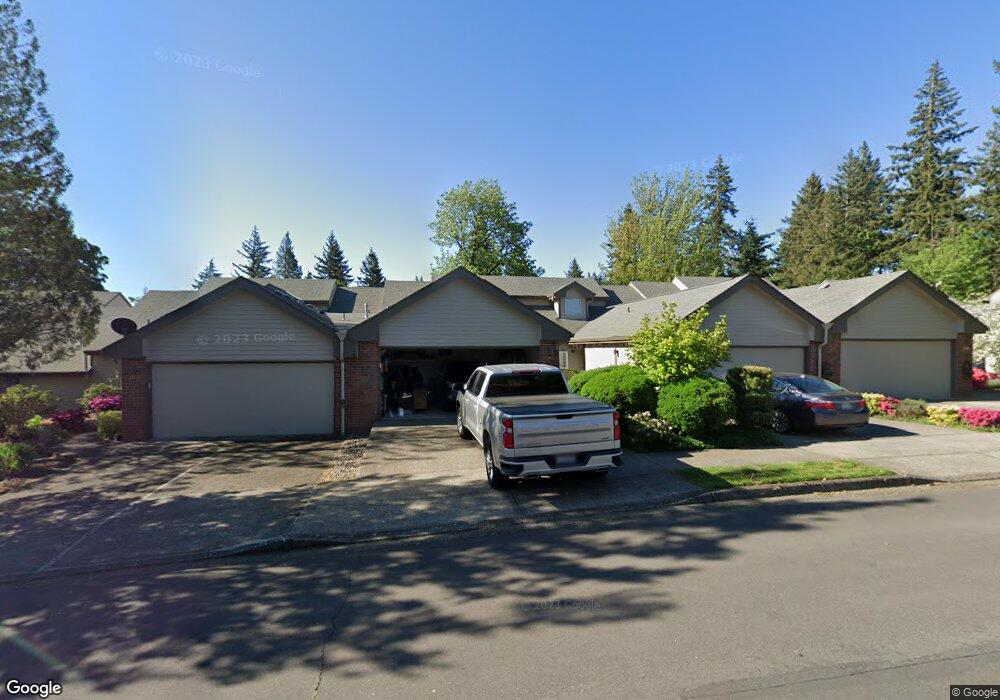
This home is located at 1208 NW 23rd Ave Unit A3, Camas, WA 98607 and is currently estimated at $416,377, approximately $265 per square foot. 1208 NW 23rd Ave Unit A3 is a home located in Clark County with nearby schools including Dorothy Fox Elementary School, Skyridge Middle School, and Camas High School.
Ownership History
Date
Name
Owned For
Owner Type
Purchase Details
Closed on
Oct 26, 2012
Sold by
Slyter Douglas C
Bought by
Dunn Miller Patricia A
Current Estimated Value
Home Financials for this Owner
Home Financials are based on the most recent Mortgage that was taken out on this home.
Original Mortgage
$96,750
Outstanding Balance
$67,203
Interest Rate
3.5%
Mortgage Type
New Conventional
Estimated Equity
$349,174
Purchase Details
Closed on
May 18, 2004
Sold by
Slyter Clayton H
Bought by
Slyter Clayton H and Trust Agreement Of Clayton Harry Slyter
Purchase Details
Closed on
Dec 3, 1998
Sold by
Bristol Theresa D
Bought by
Slyter Clayton H
Home Financials for this Owner
Home Financials are based on the most recent Mortgage that was taken out on this home.
Original Mortgage
$99,200
Interest Rate
6.78%
Mortgage Type
Purchase Money Mortgage
Create a Home Valuation Report for This Property
The Home Valuation Report is an in-depth analysis detailing your home's value as well as a comparison with similar homes in the area
Home Values in the Area
Average Home Value in this Area
Purchase History
| Date | Buyer | Sale Price | Title Company |
|---|---|---|---|
| Dunn Miller Patricia A | $129,000 | Clark County Title Co | |
| Slyter Clayton H | -- | -- | |
| Slyter Clayton H | $124,000 | Charter Title Corporation |
Source: Public Records
Mortgage History
| Date | Status | Borrower | Loan Amount |
|---|---|---|---|
| Open | Dunn Miller Patricia A | $96,750 | |
| Previous Owner | Slyter Clayton H | $99,200 |
Source: Public Records
Tax History Compared to Growth
Tax History
| Year | Tax Paid | Tax Assessment Tax Assessment Total Assessment is a certain percentage of the fair market value that is determined by local assessors to be the total taxable value of land and additions on the property. | Land | Improvement |
|---|---|---|---|---|
| 2025 | $2,709 | $279,201 | -- | $279,201 |
| 2024 | $2,611 | $284,584 | -- | $284,584 |
| 2023 | $2,686 | $230,483 | $0 | $230,483 |
| 2022 | $2,822 | $288,512 | $0 | $288,512 |
| 2021 | $2,789 | $253,329 | $0 | $253,329 |
| 2020 | $2,892 | $231,962 | $0 | $231,962 |
| 2019 | $2,791 | $223,040 | $0 | $223,040 |
| 2018 | $2,869 | $228,922 | $0 | $0 |
| 2017 | $2,442 | $197,797 | $0 | $0 |
| 2016 | $1,973 | $183,362 | $0 | $0 |
| 2015 | $2,037 | $147,300 | $0 | $0 |
| 2014 | -- | $143,456 | $0 | $0 |
| 2013 | -- | $123,113 | $0 | $0 |
Source: Public Records
Map
Nearby Homes
- 1146 NW 23rd Ave Unit A1
- 737 NW 20th Ave
- 2149 NW Fargo Loop
- 2120 NW Fargo Loop
- 2052 NW Fargo Loop
- 1402 NW 30th Ave
- 1610 NW 34th Ave
- 2012 NW Willow Dr
- 441 NW 15th Ave
- 2316 NW 26th Ave
- 3313 NW Sierra Dr
- 124 NW 18th Ave
- 1623 Division St
- 715 NW 10th Ave
- 3015 NW Vanguard Place
- 2530 NW 22nd Ave
- 863 NW Norwood Ct
- 907 NW Greeley St
- 1911 NW Astor Ct
- 2534 NW 16th Ave
- 1220 NW 23rd Ave Unit A5
- 1226 NW 23rd Ave Unit A6
- 1220 NW 23rd Ave Unit 5A
- 1210 NW 23rd Ave Unit A4
- 1154 NW 23rd Ave Unit A2
- 1161 NW 22nd Ave
- 0 NW Logan St Unit 708068
- 0 NW Logan St Unit 24 10043197
- 0 NW Logan St Unit 23
- 1122 NW 23rd Ave
- 1145 NW 22nd Ave
- 2350 NW Logan St
- 1123 NW 23rd Ave
- 1221 NW 22nd Ave
- 1133 NW 22nd Ave
- 1133 NW 22nd Ave (M)
- 2414 NW Logan St
- 1177 NW 23rd Ave
- 1002 NW 23rd Ave
- 1121 NW 22nd Ave