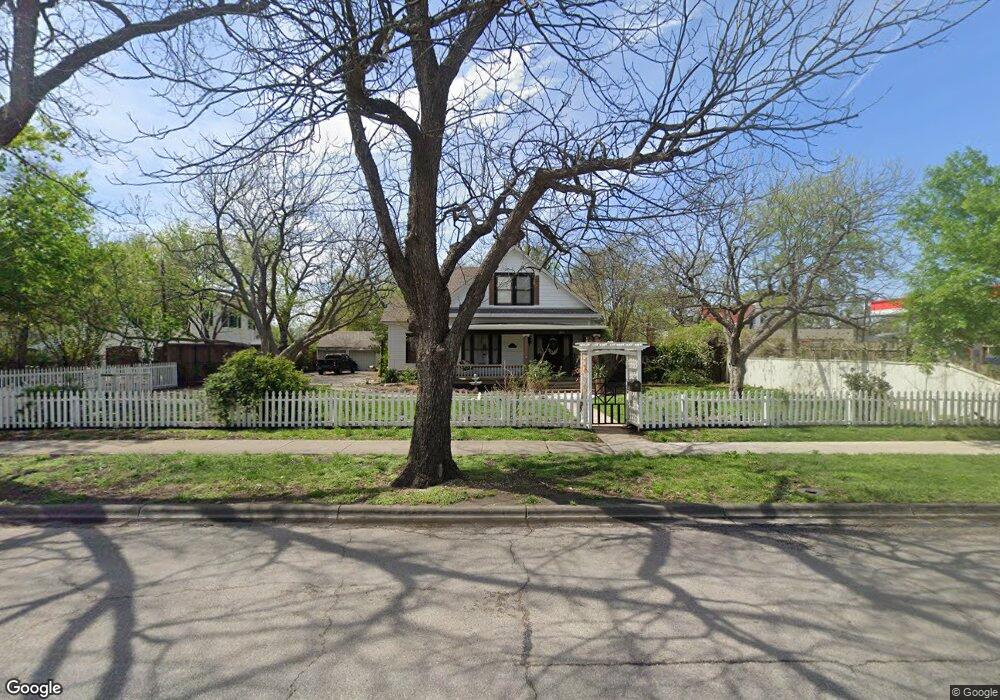
1208 S Austin Ave Georgetown, TX 78626
Estimated Value: $776,000 - $980,603
3
Beds
2
Baths
2,364
Sq Ft
$370/Sq Ft
Est. Value
About This Home
This home is located at 1208 S Austin Ave, Georgetown, TX 78626 and is currently estimated at $874,151, approximately $369 per square foot. 1208 S Austin Ave is a home located in Williamson County with nearby schools including Annie Purl Elementary School, James Tippit Middle School, and East View High School.
Ownership History
Date
Name
Owned For
Owner Type
Purchase Details
Closed on
Jan 9, 2025
Sold by
Grimes James Randall
Bought by
Coburn Laura Paige and Grimes Laura Paige
Current Estimated Value
Purchase Details
Closed on
May 13, 2021
Sold by
Grimes Laura Paige
Bought by
Grimes J Randall
Purchase Details
Closed on
Dec 28, 2015
Sold by
Grimes J Randall
Bought by
Coburn Laura Paige and Grimes Laura Paige
Purchase Details
Closed on
Jun 23, 2010
Sold by
Hewgley Robert W and Hewgley Bobette H
Bought by
Coburn Laura Paige
Purchase Details
Closed on
Aug 17, 2005
Sold by
Brass Kevin A and Brass Lietza K
Bought by
Hewgley Robert W and Hewgley Bobette H
Home Financials for this Owner
Home Financials are based on the most recent Mortgage that was taken out on this home.
Original Mortgage
$52,483
Interest Rate
5.81%
Mortgage Type
Stand Alone Second
Create a Home Valuation Report for This Property
The Home Valuation Report is an in-depth analysis detailing your home's value as well as a comparison with similar homes in the area
Home Values in the Area
Average Home Value in this Area
Purchase History
| Date | Buyer | Sale Price | Title Company |
|---|---|---|---|
| Coburn Laura Paige | -- | None Listed On Document | |
| Grimes J Randall | -- | None Listed On Document | |
| Coburn Laura Paige | -- | None Available | |
| Coburn Laura Paige | -- | Independence Title Company | |
| Hewgley Robert W | -- | None Available |
Source: Public Records
Mortgage History
| Date | Status | Borrower | Loan Amount |
|---|---|---|---|
| Previous Owner | Hewgley Robert W | $52,483 |
Source: Public Records
Tax History Compared to Growth
Tax History
| Year | Tax Paid | Tax Assessment Tax Assessment Total Assessment is a certain percentage of the fair market value that is determined by local assessors to be the total taxable value of land and additions on the property. | Land | Improvement |
|---|---|---|---|---|
| 2025 | $8,609 | $838,868 | -- | -- |
| 2024 | $8,609 | $762,607 | -- | -- |
| 2023 | $8,622 | $693,279 | $0 | $0 |
| 2022 | $12,373 | $630,254 | $0 | $0 |
| 2021 | $12,512 | $572,958 | $123,310 | $498,965 |
| 2020 | $11,551 | $520,871 | $117,452 | $403,419 |
| 2019 | $12,779 | $558,514 | $92,000 | $466,514 |
| 2018 | $11,488 | $518,507 | $92,000 | $452,491 |
| 2017 | $11,748 | $508,664 | $92,000 | $416,664 |
| 2016 | $9,897 | $428,518 | $92,000 | $336,518 |
| 2015 | $7,423 | $363,188 | $74,000 | $330,299 |
| 2014 | $7,423 | $330,171 | $0 | $0 |
Source: Public Records
Map
Nearby Homes
- 214 W University Ave
- 302 W University Ave
- 1103 S Rock St
- 1216 Forest St
- 1250 S Main St
- 1220 S Myrtle St
- 1001 S Church St
- 207 W 17th St
- 1507 Hart St
- 405 W 17th St
- 1001 Railroad St
- 205 E 9th Lot 5b St
- 1210 S Myrtle St
- 1306 S Ash St
- 711 W 10th St
- 1806 S Main St
- 1704 S Church St
- 1004 Scenic Dr
- 510 S Church St
- 204 E 18th St
- 1220 S Austin Ave
- 216 W University Ave
- 1215 S Austin Ave
- 1221 S Austin Ave
- 1201 S Rock St
- 1223 1/2 S Austin Ave
- 1223 S Austin Ave
- 1230 S Austin Ave
- 215 W University Ave Unit 2
- 215 W University Ave
- 1208 S Main St
- 1216 S Main St
- 1225 S Austin Ave
- 1102 S Austin Ave
- 310 W University Ave Unit HOUSE
- 310 W University Ave
- 310 W University Ave Unit 2
- 310 W University Ave Unit B
- 310 W University Ave Unit A
- 310 W University Ave Unit C