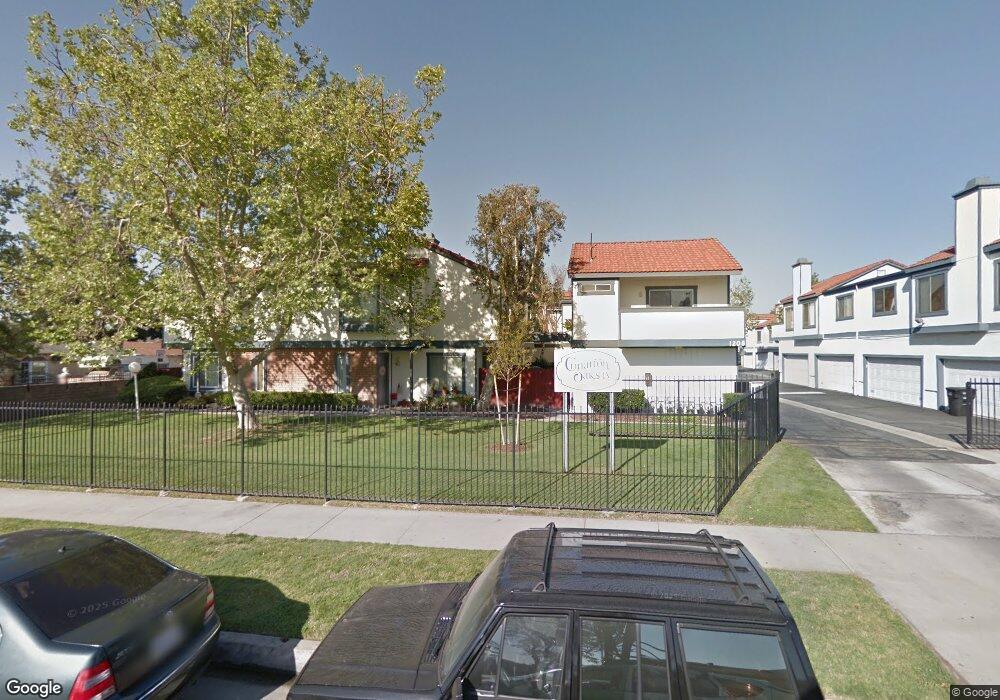
1208 S Cypress Ave Unit A Ontario, CA 91762
Downtown Ontario NeighborhoodEstimated Value: $479,000 - $496,000
3
Beds
3
Baths
1,512
Sq Ft
$322/Sq Ft
Est. Value
About This Home
This home is located at 1208 S Cypress Ave Unit A, Ontario, CA 91762 and is currently estimated at $486,128, approximately $321 per square foot. 1208 S Cypress Ave Unit A is a home located in San Bernardino County with nearby schools including Mission Elementary School, Oaks Middle, and Ontario High School.
Ownership History
Date
Name
Owned For
Owner Type
Purchase Details
Closed on
Mar 2, 2020
Sold by
Peel Jacquelin Y
Bought by
Peel Jacquelin Y
Current Estimated Value
Purchase Details
Closed on
Dec 16, 1996
Sold by
Trenkle Charles J and Trenkle Victoria A T
Bought by
Peel Jacquelin Y
Home Financials for this Owner
Home Financials are based on the most recent Mortgage that was taken out on this home.
Original Mortgage
$78,900
Interest Rate
7.53%
Mortgage Type
FHA
Purchase Details
Closed on
Nov 29, 1994
Sold by
Trenkle Charles J and Trenkle Victoria A
Bought by
Trenkle Charles J and Trenkle Victoria A
Purchase Details
Closed on
Jun 21, 1994
Sold by
Hud
Bought by
Trenkle Charles J and Trenkle Victoria A
Home Financials for this Owner
Home Financials are based on the most recent Mortgage that was taken out on this home.
Original Mortgage
$49,600
Interest Rate
6.8%
Purchase Details
Closed on
Dec 5, 1993
Sold by
Fleet Mtg Corp
Bought by
Hud
Create a Home Valuation Report for This Property
The Home Valuation Report is an in-depth analysis detailing your home's value as well as a comparison with similar homes in the area
Home Values in the Area
Average Home Value in this Area
Purchase History
| Date | Buyer | Sale Price | Title Company |
|---|---|---|---|
| Peel Jacquelin Y | -- | Law Offices Of Brian W Smethur | |
| Peel Jacquelin Y | $85,000 | Old Republic Title Company | |
| Trenkle Charles J | -- | -- | |
| Trenkle Charles J | $62,000 | Commonwealth Land Title Co | |
| Hud | -- | First Southwestern Title Com |
Source: Public Records
Mortgage History
| Date | Status | Borrower | Loan Amount |
|---|---|---|---|
| Previous Owner | Peel Jacquelin Y | $78,900 | |
| Previous Owner | Trenkle Charles J | $49,600 |
Source: Public Records
Tax History Compared to Growth
Tax History
| Year | Tax Paid | Tax Assessment Tax Assessment Total Assessment is a certain percentage of the fair market value that is determined by local assessors to be the total taxable value of land and additions on the property. | Land | Improvement |
|---|---|---|---|---|
| 2025 | $4,785 | $445,708 | $155,998 | $289,710 |
| 2024 | $4,785 | $436,968 | $152,939 | $284,029 |
| 2023 | $4,651 | $428,400 | $149,940 | $278,460 |
| 2022 | $1,313 | $126,099 | $30,696 | $95,403 |
| 2021 | $1,304 | $123,626 | $30,094 | $93,532 |
| 2020 | $1,280 | $122,358 | $29,785 | $92,573 |
| 2019 | $1,268 | $119,959 | $29,201 | $90,758 |
| 2018 | $1,249 | $117,606 | $28,628 | $88,978 |
| 2017 | $1,203 | $115,300 | $28,067 | $87,233 |
| 2016 | $1,154 | $113,040 | $27,517 | $85,523 |
| 2015 | $1,145 | $111,342 | $27,104 | $84,238 |
| 2014 | $1,108 | $109,161 | $26,573 | $82,588 |
Source: Public Records
Map
Nearby Homes
- 1206 S Cypress Ave Unit F
- 1216 S Cypress Ave Unit E
- 754 W Belmont St
- 1031 S Palmetto Ave Unit N9
- 1031 S Palmetto Ave Unit II3
- 1031 S Palmetto Ave Unit N1
- 1031 S Palmetto Ave Unit W8
- 653 W Belmont St
- 842 Carlton Privado
- 920 S Palmetto Ave Unit 9
- 550 W Belmont St
- 1052 W Ralston St
- 863 S Mountain Ave Unit 22
- 1150 W Phillips St Unit 126
- 1546 Redwood Ave
- 555 W Elm St
- 850 W Mission Blvd Unit A46
- 850 W Mission Blvd
- 831 S Mountain Ave Unit 6
- 1020 S Mountain Ave
- 1208 S Cypress Ave
- 1208 S Cypress Ave Unit G
- 1208 S Cypress Ave Unit F
- 1208 S Cypress Ave Unit E
- 1208 S Cypress Ave Unit D
- 1208 S Cypress Ave Unit C
- 1208 S Cypress Ave Unit B
- 1238 S Cypress Ave
- 1212 S Cypress Ave Unit E
- 1212 S Cypress Ave Unit D
- 1212 S Cypress Ave Unit C
- 1212 S Cypress Ave Unit B
- 1212 S Cypress Ave Unit A
- 1212 S Cypress Ave Unit G
- 1212 S Cypress Ave Unit F
- 1210 S Cypress Ave
- 1210 S Cypress Ave Unit G
- 1210 S Cypress Ave Unit F
- 1210 S Cypress Ave Unit E
- 1210 S Cypress Ave Unit D