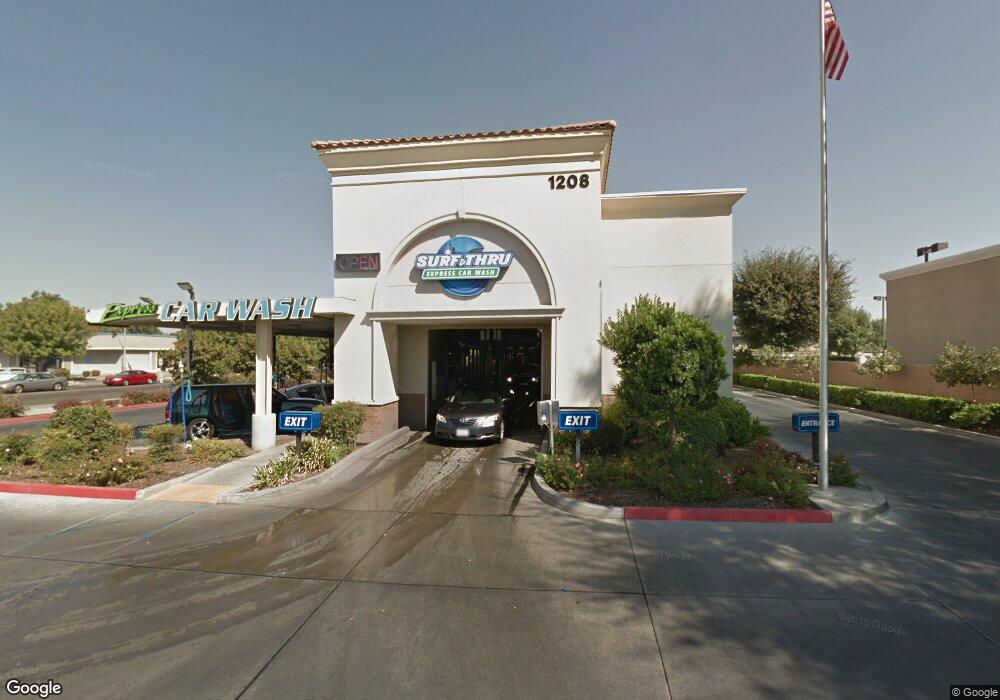
1208 S Mooney Blvd Unit BACK Visalia, CA 93277
Mooney Neighborhood
--
Bed
2
Baths
4,852
Sq Ft
1.07
Acres
About This Home
This home is located at 1208 S Mooney Blvd Unit BACK, Visalia, CA 93277. 1208 S Mooney Blvd Unit BACK is a home located in Tulare County with nearby schools including Divisadero Middle School, Mt. Whitney High School, and Charter Home School Academy.
Ownership History
Date
Name
Owned For
Owner Type
Purchase Details
Closed on
Nov 24, 2010
Sold by
National Financial Lending Llc
Bought by
Surf Thru Inc
Purchase Details
Closed on
Mar 18, 2010
Sold by
Luiz David J
Bought by
National Financial Lending Llc and Point Center Mortgage Fund I Llc
Purchase Details
Closed on
Aug 20, 2007
Sold by
Suncor Holdings Cop Ii Llc
Bought by
Luiz David
Home Financials for this Owner
Home Financials are based on the most recent Mortgage that was taken out on this home.
Original Mortgage
$800,000
Interest Rate
6.74%
Mortgage Type
Commercial
Purchase Details
Closed on
Dec 21, 2005
Sold by
Conocophillips Co
Bought by
Suncor Holdings Cop Ii Llc
Home Financials for this Owner
Home Financials are based on the most recent Mortgage that was taken out on this home.
Original Mortgage
$104,865,329
Interest Rate
6.27%
Mortgage Type
Commercial
Purchase Details
Closed on
Apr 7, 1997
Sold by
Union Oil Company Of California
Bought by
Tosco Corp
Create a Home Valuation Report for This Property
The Home Valuation Report is an in-depth analysis detailing your home's value as well as a comparison with similar homes in the area
Home Values in the Area
Average Home Value in this Area
Purchase History
| Date | Buyer | Sale Price | Title Company |
|---|---|---|---|
| Surf Thru Inc | $778,000 | Placer Title Company | |
| National Financial Lending Llc | $509,331 | Chicago Title | |
| Luiz David | -- | North American Title | |
| Suncor Holdings Cop Ii Llc | -- | Stewart Title California Inc | |
| Tosco Corp | -- | First American Title |
Source: Public Records
Mortgage History
| Date | Status | Borrower | Loan Amount |
|---|---|---|---|
| Previous Owner | Luiz David | $800,000 | |
| Previous Owner | Suncor Holdings Cop Ii Llc | $104,865,329 |
Source: Public Records
Tax History Compared to Growth
Tax History
| Year | Tax Paid | Tax Assessment Tax Assessment Total Assessment is a certain percentage of the fair market value that is determined by local assessors to be the total taxable value of land and additions on the property. | Land | Improvement |
|---|---|---|---|---|
| 2025 | $25,675 | $2,171,169 | $996,757 | $1,174,412 |
| 2024 | $25,675 | $2,396,498 | $977,213 | $1,419,285 |
| 2023 | $25,245 | $2,375,491 | $958,052 | $1,417,439 |
| 2022 | $24,360 | $2,352,023 | $939,267 | $1,412,756 |
| 2021 | $24,517 | $2,317,766 | $920,850 | $1,396,916 |
| 2020 | $25,000 | $2,347,889 | $911,408 | $1,436,481 |
| 2019 | $24,809 | $2,365,532 | $893,537 | $1,471,995 |
| 2018 | $24,590 | $2,342,879 | $876,017 | $1,466,862 |
| 2017 | $24,320 | $2,311,074 | $858,840 | $1,452,234 |
| 2016 | $24,686 | $2,327,713 | $842,000 | $1,485,713 |
| 2015 | $21,400 | $2,022,813 | $829,352 | $1,193,461 |
| 2014 | $21,400 | $2,005,906 | $813,106 | $1,192,800 |
Source: Public Records
Map
Nearby Homes
- 1419 S Crowe St
- 1608 S Central St
- 1640 W Princeton Ct
- 2419 W Harvard Ave
- 621 S Divisadero St
- 1330 S Clover St
- 1301 W Beverly Dr
- 1406 W Princeton Ave
- 1103 S Linda Vista St
- 1107 W Westcott Ave
- 1138 S Valley St
- 2301 S Divisadero St Unit 8
- 2301 S Divisadero St Unit 9
- 2921 W Cornell Ave
- 2013 S Giddings St
- 1315 S Conyer St
- 2135 S Woodland St
- 3124 W Tulare Ave
- 1127 S Whitney Dr
- 3125 W Howard Ave
- 1800 W Tulare Ave
- 1215 S Central St
- 1300 S Mooney Blvd Unit 6
- 1300 S Mooney Blvd Unit 7
- 1300 S Mooney Blvd Unit 5
- 1300 S Mooney Blvd Unit 3
- 1312 S Mooney Blvd
- 1716 W Tulare Ave
- 1318 S Mooney Blvd
- 1349 S Mooney Blvd
- 1719 W Laurel Ave
- 1206 S Central St
- 1721 W Tulare Ave
- 1321 S Central St
- 1212 S Central St
- 1127 S Mooney Blvd
- 1712 W Tulare Ave
- 1216 S Central St
- 1717 W Laurel Ave
- 1220 S Central St