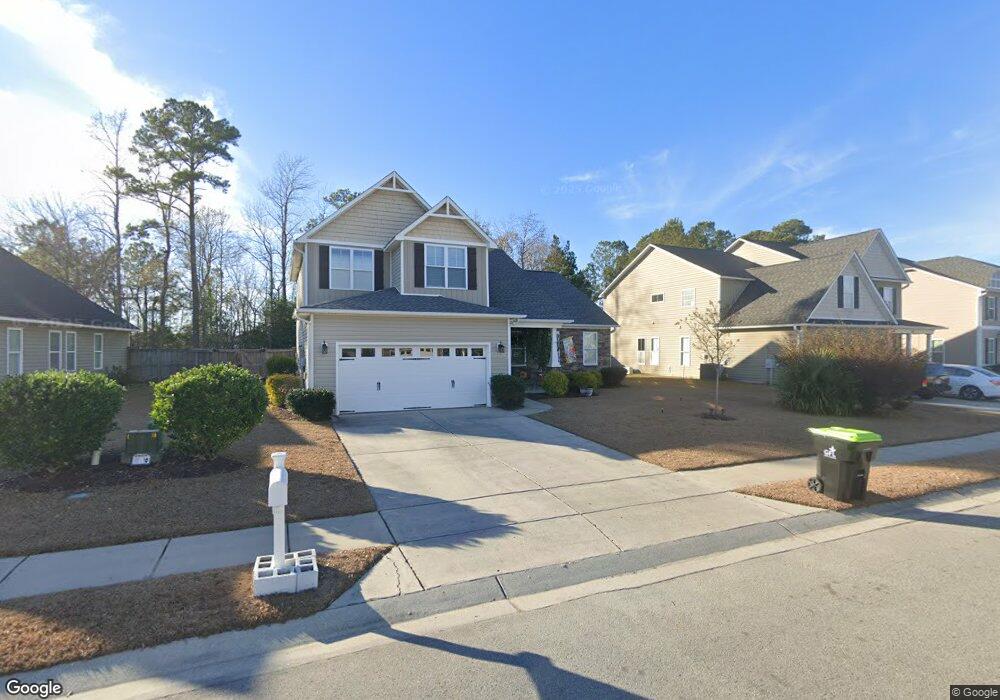
1208 South Brook Rd Winnabow, NC 28479
Estimated Value: $394,000 - $425,000
3
Beds
3
Baths
2,275
Sq Ft
$179/Sq Ft
Est. Value
About This Home
This home is located at 1208 South Brook Rd, Winnabow, NC 28479 and is currently estimated at $407,047, approximately $178 per square foot. 1208 South Brook Rd is a home located in Brunswick County with nearby schools including Belville Elementary School, Leland Middle School, and North Brunswick High School.
Ownership History
Date
Name
Owned For
Owner Type
Purchase Details
Closed on
Jul 21, 2016
Sold by
Varchetto Maria and Varchetto Joseph J
Bought by
Smith Theresa A
Current Estimated Value
Purchase Details
Closed on
Jan 28, 2014
Sold by
Secretary Of Veterans Affairs
Bought by
Lewis Maria
Home Financials for this Owner
Home Financials are based on the most recent Mortgage that was taken out on this home.
Original Mortgage
$188,775
Interest Rate
4.55%
Mortgage Type
New Conventional
Purchase Details
Closed on
May 28, 2013
Sold by
Trepoy Franklin and Johns Diana
Bought by
Bank Of America Na
Purchase Details
Closed on
Jun 30, 2009
Sold by
Stevens Home Investments Inc
Bought by
Trepoy Franklin and Trepoy Susan C
Home Financials for this Owner
Home Financials are based on the most recent Mortgage that was taken out on this home.
Original Mortgage
$259,654
Interest Rate
4.79%
Mortgage Type
VA
Create a Home Valuation Report for This Property
The Home Valuation Report is an in-depth analysis detailing your home's value as well as a comparison with similar homes in the area
Home Values in the Area
Average Home Value in this Area
Purchase History
| Date | Buyer | Sale Price | Title Company |
|---|---|---|---|
| Smith Theresa A | $200,000 | None Available | |
| Lewis Maria | $185,000 | None Available | |
| Bank Of America Na | $247,500 | None Available | |
| Trepoy Franklin | $251,500 | None Available |
Source: Public Records
Mortgage History
| Date | Status | Borrower | Loan Amount |
|---|---|---|---|
| Previous Owner | Lewis Maria | $188,775 | |
| Previous Owner | Trepoy Franklin | $259,654 |
Source: Public Records
Tax History Compared to Growth
Tax History
| Year | Tax Paid | Tax Assessment Tax Assessment Total Assessment is a certain percentage of the fair market value that is determined by local assessors to be the total taxable value of land and additions on the property. | Land | Improvement |
|---|---|---|---|---|
| 2025 | $2,590 | $357,830 | $54,000 | $303,830 |
| 2024 | $2,590 | $357,830 | $54,000 | $303,830 |
| 2023 | $2,218 | $357,830 | $54,000 | $303,830 |
| 2022 | $2,218 | $256,810 | $55,000 | $201,810 |
| 2021 | $0 | $256,810 | $55,000 | $201,810 |
| 2020 | $2,072 | $250,690 | $55,000 | $195,690 |
| 2019 | $2,042 | $56,470 | $55,000 | $1,470 |
| 2018 | $1,707 | $29,220 | $27,500 | $1,720 |
| 2017 | $1,707 | $29,220 | $27,500 | $1,720 |
| 2016 | $1,601 | $29,220 | $27,500 | $1,720 |
| 2015 | $1,535 | $209,670 | $27,500 | $182,170 |
| 2014 | $1,386 | $199,654 | $25,000 | $174,654 |
Source: Public Records
Map
Nearby Homes
- 1187 S Brook Rd
- 123 Cove Landing
- 115 Cove Landing
- 3378 Hemlock Way
- 335 St Kitts Way
- 3330 Hemlock Way Unit Lot 128
- 368 St Kitts Way
- 376 St Kitts Way
- 3057 Smeades Dr
- 222 Bimini Dr
- 420 Saint Kitts Way
- 3045 Smeades Dr
- 1315 Star Grass Way
- 511 Heartwood Dr
- 8267 Paramount Point
- 8288 Paramount Point
- 8368 Paramount Point
- 2111 Shelmore Way
- 350 Heartwood Dr Unit 4
- 8385 Paramount Point
- 1208 S Brook Rd
- 1212 S Brook Rd
- 1204 South Brook Rd
- 1204 S Brook Rd
- 1212 South Brook Rd
- 1216 S Brook Rd
- 1200 S South Brook Rd
- 1200 South Brook Rd
- 1216 South Brook Rd
- 1200 S Brook Rd
- 1220 South Brook Rd
- 1196 South Brook Rd
- 1196 S Brook Rd
- 1213 South Brook Rd
- 1201 South Brook Rd
- 1201 S Brook Rd
- 1220 S Brook Rd
- 1205 South Brook Rd
- 1205 S Brook Rd
- 5371 Black Oak Ct Unit Lot 24