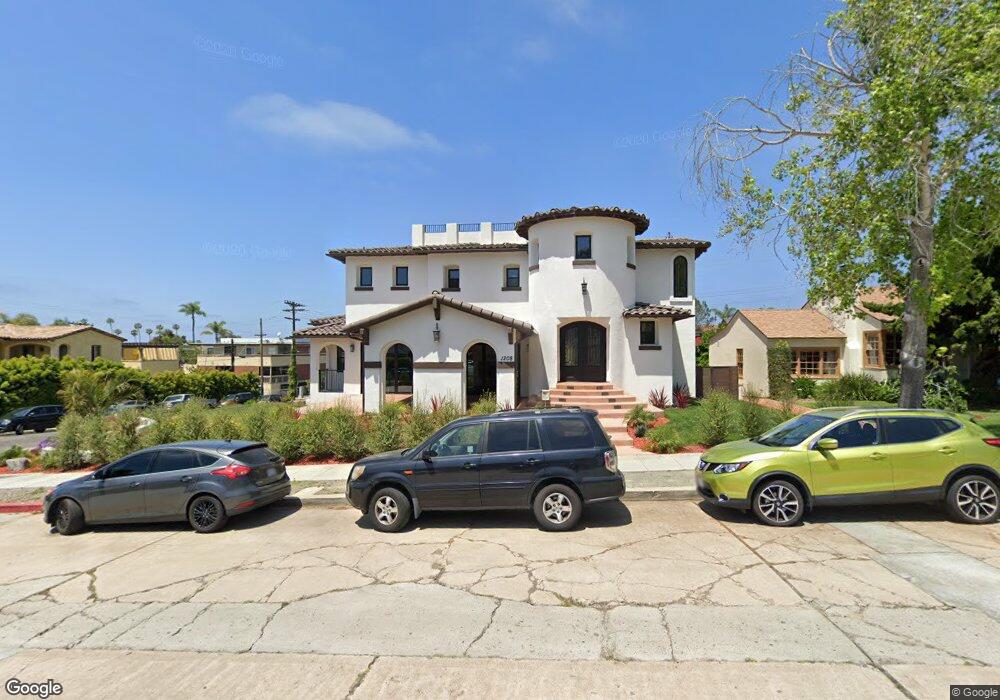
1208 Virginia Way La Jolla, CA 92037
The Village NeighborhoodEstimated Value: $5,224,959 - $5,925,000
5
Beds
5
Baths
3,615
Sq Ft
$1,516/Sq Ft
Est. Value
About This Home
This home is located at 1208 Virginia Way, La Jolla, CA 92037 and is currently estimated at $5,479,240, approximately $1,515 per square foot. 1208 Virginia Way is a home located in San Diego County with nearby schools including La Jolla Elementary School, Muirlands Middle School, and La Jolla High School.
Ownership History
Date
Name
Owned For
Owner Type
Purchase Details
Closed on
May 15, 2019
Sold by
La Jolla Acquisition Co Llc
Bought by
Knox Trust
Current Estimated Value
Purchase Details
Closed on
Oct 19, 2018
Sold by
Jernigan Troy and Jernigan Heather
Bought by
La Jolla Acquisition Co Llc
Purchase Details
Closed on
Jan 4, 2017
Sold by
Banks Lincoln H
Bought by
Jernigan Troy and Jernigan Heather
Purchase Details
Closed on
Mar 18, 2010
Sold by
Erickson Sylvia E
Bought by
Erickson Sylvia S
Purchase Details
Closed on
Mar 30, 1994
Sold by
Erickson Sylvia S and Condra Sylvia Sauza
Bought by
Erickson Sylvia S
Home Financials for this Owner
Home Financials are based on the most recent Mortgage that was taken out on this home.
Original Mortgage
$210,000
Interest Rate
6.37%
Purchase Details
Closed on
Jul 29, 1988
Create a Home Valuation Report for This Property
The Home Valuation Report is an in-depth analysis detailing your home's value as well as a comparison with similar homes in the area
Home Values in the Area
Average Home Value in this Area
Purchase History
| Date | Buyer | Sale Price | Title Company |
|---|---|---|---|
| Knox Trust | $3,670,000 | Chicago Title Company | |
| La Jolla Acquisition Co Llc | -- | Chicago Title Company | |
| Jernigan Troy | $1,535,000 | Chicago Title Company | |
| Erickson Sylvia S | -- | None Available | |
| Erickson Sylvia S | -- | Benefit Land Title | |
| -- | $400,000 | -- |
Source: Public Records
Mortgage History
| Date | Status | Borrower | Loan Amount |
|---|---|---|---|
| Previous Owner | Erickson Sylvia S | $210,000 |
Source: Public Records
Tax History
| Year | Tax Paid | Tax Assessment Tax Assessment Total Assessment is a certain percentage of the fair market value that is determined by local assessors to be the total taxable value of land and additions on the property. | Land | Improvement |
|---|---|---|---|---|
| 2025 | $49,239 | $4,093,952 | $2,509,917 | $1,584,035 |
| 2024 | $49,239 | $4,013,679 | $2,460,703 | $1,552,976 |
| 2023 | $48,155 | $3,934,980 | $2,412,454 | $1,522,526 |
| 2022 | $46,873 | $3,857,824 | $2,365,151 | $1,492,673 |
| 2021 | $46,550 | $3,782,181 | $2,318,776 | $1,463,405 |
| 2020 | $46,070 | $3,743,400 | $2,295,000 | $1,448,400 |
| 2019 | $30,815 | $2,498,580 | $1,508,580 | $990,000 |
| 2018 | $19,774 | $1,680,700 | $1,479,000 | $201,700 |
| 2017 | $7,596 | $646,756 | $485,077 | $161,679 |
| 2016 | $7,476 | $634,075 | $475,566 | $158,509 |
| 2015 | $7,365 | $624,552 | $468,423 | $156,129 |
| 2014 | $7,250 | $612,319 | $459,248 | $153,071 |
Source: Public Records
Map
Nearby Homes
- 1221 Virginia Way
- 1138 Virginia Way
- 7447 Herschel Ave
- 7651 Country Club Dr
- 1420 La Jolla Knoll
- 7817 Exchange Place Unit 23
- 1586 Crespo Dr
- 7964 Prospect Place
- 7560 Eads Ave Unit 12
- 7550 Eads Ave Unit 307
- 7825 Prospect Place
- 7811 Eads Ave Unit 206
- 7811 Eads Ave Unit 311
- 1550 Bluebird Ln
- 7376 Fay Ave
- 1303-15 Cave St
- 7509 Draper Ave Unit 306
- 7520 Draper Ave Unit 3
- 1641 Crespo Dr
- 1010 Coast Blvd S Unit 1
- 1214 Virginia Way
- 7617 High Ave
- 1178 Virginia Way
- 1236 Virginia Way
- 1231 Virginia Way
- 1215 Virginia Way
- 1168 Virginia Way
- 1235 Virginia Way
- 7665 High Ave
- 1211 Virginia Way
- 1215 Torrey Pines Rd
- 1221 Torrey Pines Rd
- 1245 Virginia Way
- 1246 Virginia Way
- 1156 Virginia Way
- 1201 Virginia Way
- 1135 Torrey Pines Rd Unit 1
- 1135 Torrey Pines Rd Unit PH
- 1135 Torrey Pines Rd Unit 2A
- 1135 Torrey Pines Rd
Your Personal Tour Guide
Ask me questions while you tour the home.