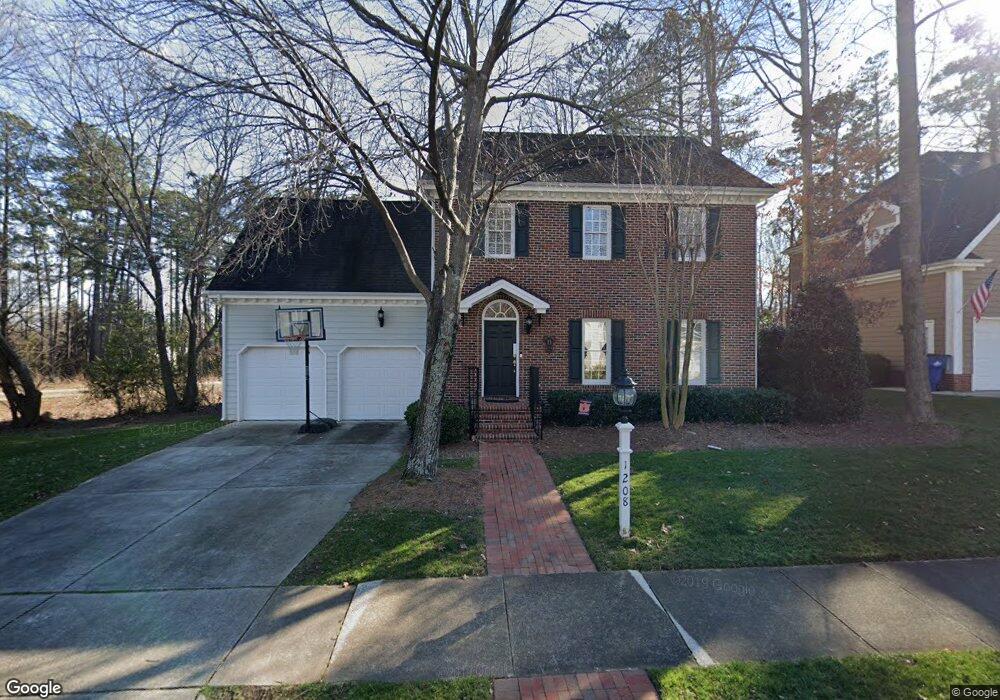
1208 Walkertown Dr Raleigh, NC 27614
Estimated Value: $544,390 - $577,000
3
Beds
3
Baths
2,193
Sq Ft
$254/Sq Ft
Est. Value
About This Home
This home is located at 1208 Walkertown Dr, Raleigh, NC 27614 and is currently estimated at $557,848, approximately $254 per square foot. 1208 Walkertown Dr is a home located in Wake County with nearby schools including Abbotts Creek Elementary School, East Millbrook Middle, and Millbrook High School.
Ownership History
Date
Name
Owned For
Owner Type
Purchase Details
Closed on
Feb 1, 2006
Sold by
Briggs Brian B
Bought by
Briggs Angela H
Current Estimated Value
Home Financials for this Owner
Home Financials are based on the most recent Mortgage that was taken out on this home.
Original Mortgage
$25,000
Outstanding Balance
$14,146
Interest Rate
6.19%
Mortgage Type
Credit Line Revolving
Estimated Equity
$543,702
Purchase Details
Closed on
Aug 10, 2000
Sold by
Homes By Dickerson Inc
Bought by
Briggs Brian B and Briggs Angela H
Home Financials for this Owner
Home Financials are based on the most recent Mortgage that was taken out on this home.
Original Mortgage
$198,750
Interest Rate
8.05%
Purchase Details
Closed on
May 31, 2000
Sold by
Poohbear Development Company
Bought by
Homes By Dickerson Inc
Create a Home Valuation Report for This Property
The Home Valuation Report is an in-depth analysis detailing your home's value as well as a comparison with similar homes in the area
Home Values in the Area
Average Home Value in this Area
Purchase History
| Date | Buyer | Sale Price | Title Company |
|---|---|---|---|
| Briggs Angela H | -- | None Available | |
| Briggs Brian B | $248,500 | -- | |
| Homes By Dickerson Inc | $160,000 | -- |
Source: Public Records
Mortgage History
| Date | Status | Borrower | Loan Amount |
|---|---|---|---|
| Open | Briggs Angela H | $25,000 | |
| Open | Briggs Angela H | $220,000 | |
| Closed | Briggs Brian B | $198,750 |
Source: Public Records
Tax History Compared to Growth
Tax History
| Year | Tax Paid | Tax Assessment Tax Assessment Total Assessment is a certain percentage of the fair market value that is determined by local assessors to be the total taxable value of land and additions on the property. | Land | Improvement |
|---|---|---|---|---|
| 2025 | $4,391 | $501,227 | $110,000 | $391,227 |
| 2024 | $4,373 | $501,227 | $110,000 | $391,227 |
| 2023 | $3,925 | $358,294 | $110,000 | $248,294 |
| 2022 | $3,648 | $358,294 | $110,000 | $248,294 |
| 2021 | $3,506 | $358,294 | $110,000 | $248,294 |
| 2020 | $3,442 | $358,294 | $110,000 | $248,294 |
| 2019 | $3,684 | $316,171 | $71,000 | $245,171 |
| 2018 | $3,474 | $316,171 | $71,000 | $245,171 |
| 2017 | $3,309 | $316,171 | $71,000 | $245,171 |
| 2016 | $3,241 | $316,171 | $71,000 | $245,171 |
| 2015 | $3,369 | $323,413 | $76,000 | $247,413 |
| 2014 | $3,195 | $323,413 | $76,000 | $247,413 |
Source: Public Records
Map
Nearby Homes
- 1301 Durlain Dr Unit 103
- 1310 Durlain Dr Unit 103
- 1404 Mitford Woods Ct
- 10506 Pleasant Branch Dr Unit Lot 38
- 10520 Pleasant Branch Dr Unit Lot 32
- 11035 Southwalk Ln
- 10534 Pleasant Branch Dr Unit Lot 30
- 10531 Pleasant Branch Dr Unit 201
- 10542 Pleasant Branch Dr Unit Lot 27
- 11020 Southwalk Ln
- 10546 Pleasant Branch Dr Unit Lot 25
- 10548 Pleasant Branch Dr Unit Lot 24
- 10552 Pleasant Branch Dr Unit Lot 23
- 10554 Pleasant Branch Dr Unit Lot 22
- 10547 Pleasant Branch Dr Unit 201
- 10549 Pleasant Branch Dr Unit 201
- 10549 Pleasant Branch Dr Unit 101
- 10556 Pleasant Branch Dr Unit Lot 21
- 10558 Pleasant Branch Dr Unit Lot 20
- 10560 Pleasant Branch Dr Unit Lot 19
- 1204 Walkertown Dr
- 1216 Walkertown Dr
- 1200 Walkertown Dr
- 10312 Rocky Ford Ct
- 1209 Walkertown Dr
- 1205 Walkertown Dr
- 1201 Walkertown Dr
- 1215 Walkertown Dr
- 10308 Rocky Ford Ct
- 1219 Walkertown Dr
- 1320 Walkertown Dr
- 10315 Rocky Ford Ct
- 10412 Rocky Ford Ct
- 1105 Walkertown Dr
- 10304 Rocky Ford Ct
- 10307 Rocky Ford Ct
- 1301 Walkertown Dr
- 10309 Tanners Mill Place
- 10305 Tanners Mill Place
- 10405 Rocky Ford Ct