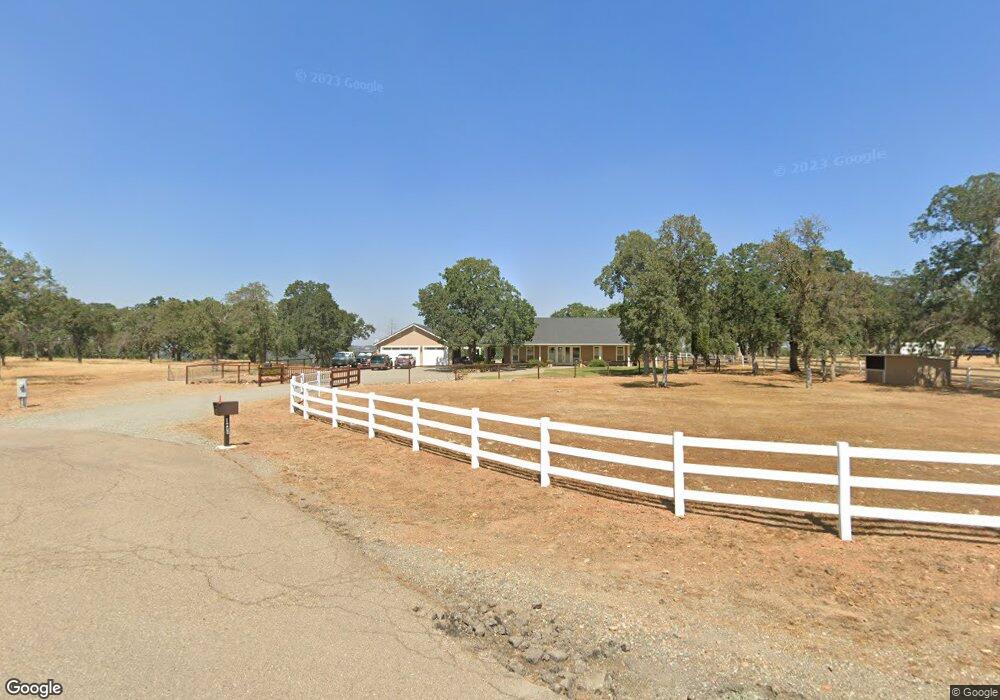
12080 Lazy Ln Red Bluff, CA 96080
Estimated Value: $548,000 - $857,000
2
Beds
3
Baths
2,200
Sq Ft
$313/Sq Ft
Est. Value
About This Home
This home is located at 12080 Lazy Ln, Red Bluff, CA 96080 and is currently estimated at $689,286, approximately $313 per square foot. 12080 Lazy Ln is a home located in Tehama County with nearby schools including Reeds Creek Elementary School, Red Bluff High School, and Whittenberg Country School.
Ownership History
Date
Name
Owned For
Owner Type
Purchase Details
Closed on
Jan 24, 2019
Sold by
Hare Cynthia O
Bought by
Cole Janet Lee
Current Estimated Value
Purchase Details
Closed on
May 29, 2009
Sold by
Marriott Loleta
Bought by
Marriott Loleta and Ohare Cynthia
Purchase Details
Closed on
Aug 27, 2007
Sold by
Ray Gary M and Ray Debra A
Bought by
Marriott Loleta
Home Financials for this Owner
Home Financials are based on the most recent Mortgage that was taken out on this home.
Original Mortgage
$400,000
Interest Rate
6.74%
Mortgage Type
Balloon
Purchase Details
Closed on
Apr 20, 2004
Sold by
Jjd Investments Llc
Bought by
Ray Gary M and Ray Debra A
Create a Home Valuation Report for This Property
The Home Valuation Report is an in-depth analysis detailing your home's value as well as a comparison with similar homes in the area
Home Values in the Area
Average Home Value in this Area
Purchase History
| Date | Buyer | Sale Price | Title Company |
|---|---|---|---|
| Cole Janet Lee | $525,000 | Northern California Title Co | |
| Marriott Loleta | -- | None Available | |
| Marriott Loleta | $655,000 | Northern California Title Co | |
| Ray Gary M | $165,000 | Northern California Title Co |
Source: Public Records
Mortgage History
| Date | Status | Borrower | Loan Amount |
|---|---|---|---|
| Previous Owner | Marriott Loleta | $400,000 |
Source: Public Records
Tax History Compared to Growth
Tax History
| Year | Tax Paid | Tax Assessment Tax Assessment Total Assessment is a certain percentage of the fair market value that is determined by local assessors to be the total taxable value of land and additions on the property. | Land | Improvement |
|---|---|---|---|---|
| 2025 | $6,228 | $623,328 | $139,437 | $483,891 |
| 2023 | $6,145 | $599,124 | $134,023 | $465,101 |
| 2022 | $5,704 | $562,378 | $131,396 | $430,982 |
| 2021 | $5,601 | $551,352 | $128,820 | $422,532 |
| 2020 | $5,599 | $545,700 | $127,500 | $418,200 |
| 2019 | $5,651 | $535,000 | $125,000 | $410,000 |
| 2018 | $5,227 | $515,804 | $212,621 | $303,183 |
| 2017 | $4,885 | $468,913 | $193,292 | $275,621 |
| 2016 | $4,427 | $446,584 | $184,088 | $262,496 |
| 2015 | -- | $446,584 | $184,088 | $262,496 |
| 2014 | $3,860 | $388,335 | $160,077 | $228,258 |
Source: Public Records
Map
Nearby Homes
- 12060 Lazy Ln
- 19235 Ridge Rd
- 12072 Alta Vista Ct
- 18920 Reeds Creek Rd
- 19365 MacHo Rd
- 18830 Newman Rd
- 20050 Plains Dr
- 18640 Farris St
- 13185 Montecito Rd
- 18595 Morris Ct
- 20225 Stewart Rd
- 20285 Stewart Rd
- 0 Stewart Rd Unit 20250381
- 0 Stewart Rd Unit 20250380
- 11565 Wilder Rd
- 20360 Acorn Ave
- 20481 Womack Rd
- Lot 12&13 Lazy Ln
- 12090 Lazy Ln
- Lot 12 & 13 Lazy Ln
- 12060 Lazy Ln Unit lot 13
- 0 Lazy Ln
- Lot 12 Lazy Ln
- 12095 Lazy Ln
- 12055 Lazy Ln
- 19269 Live Oak Rd
- 19280 Ridge Rd
- 12230 Angel Ct
- 19185 Live Oak Rd
- 12160 Angel Ct
- 12100 Angel Ct
- 19260 Ridge Rd Unit B
- 19260 Ridge Rd
- 19105 Ridge Rd Unit 19095 Ridge Road
- 19105 Ridge Rd
- 19255 Live Oak Rd
- 19300 Cascade View Ln