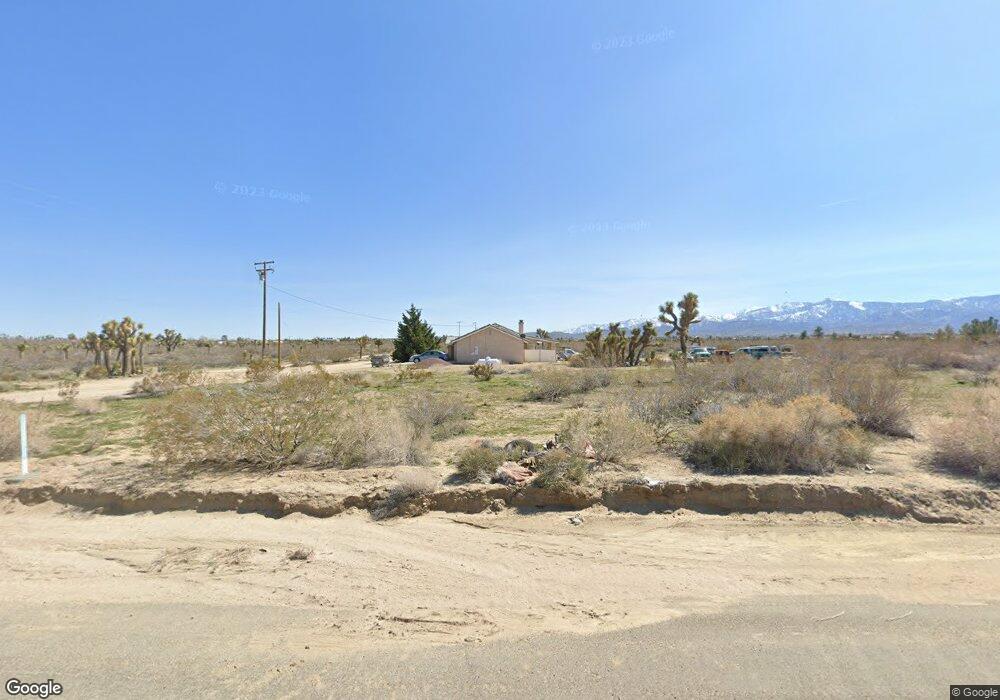
12082 Schlitz Rd Phelan, CA 92371
Estimated Value: $378,000 - $506,000
3
Beds
2
Baths
1,926
Sq Ft
$236/Sq Ft
Est. Value
About This Home
This home is located at 12082 Schlitz Rd, Phelan, CA 92371 and is currently estimated at $454,932, approximately $236 per square foot. 12082 Schlitz Rd is a home located in San Bernardino County with nearby schools including Phelan Elementary School, Quail Valley Middle School, and Serrano High School.
Ownership History
Date
Name
Owned For
Owner Type
Purchase Details
Closed on
Mar 6, 2024
Sold by
Camacho Arnulfo
Bought by
Camacho Family 2024 Revocable Trust and Camacho
Current Estimated Value
Purchase Details
Closed on
Sep 1, 2012
Sold by
Camacho Eniqueta
Bought by
Camacho Arnulfo
Home Financials for this Owner
Home Financials are based on the most recent Mortgage that was taken out on this home.
Original Mortgage
$190,660
Interest Rate
3.27%
Mortgage Type
New Conventional
Purchase Details
Closed on
Aug 22, 2006
Sold by
Safe & Sound Systems Inc
Bought by
Camacho Arnulfo
Purchase Details
Closed on
Jun 16, 2006
Sold by
Mandalyn Inc
Bought by
Safe & Sound Systems Inc
Purchase Details
Closed on
Sep 2, 2005
Sold by
Delgado Richard C
Bought by
Mandalyn Inc
Create a Home Valuation Report for This Property
The Home Valuation Report is an in-depth analysis detailing your home's value as well as a comparison with similar homes in the area
Home Values in the Area
Average Home Value in this Area
Purchase History
| Date | Buyer | Sale Price | Title Company |
|---|---|---|---|
| Camacho Family 2024 Revocable Trust | -- | None Listed On Document | |
| Camacho Arnulfo | -- | Service Link | |
| Camacho Arnulfo | $97,500 | First American Title Company | |
| Safe & Sound Systems Inc | $80,000 | First American | |
| Mandalyn Inc | $85,000 | First American |
Source: Public Records
Mortgage History
| Date | Status | Borrower | Loan Amount |
|---|---|---|---|
| Previous Owner | Camacho Arnulfo | $190,660 |
Source: Public Records
Tax History
| Year | Tax Paid | Tax Assessment Tax Assessment Total Assessment is a certain percentage of the fair market value that is determined by local assessors to be the total taxable value of land and additions on the property. | Land | Improvement |
|---|---|---|---|---|
| 2025 | $3,890 | $307,955 | $130,629 | $177,326 |
| 2024 | $3,646 | $301,917 | $128,068 | $173,849 |
| 2023 | $3,603 | $295,997 | $125,557 | $170,440 |
| 2022 | $3,519 | $290,193 | $123,095 | $167,098 |
| 2021 | $3,454 | $284,503 | $120,681 | $163,822 |
| 2020 | $3,411 | $281,586 | $119,444 | $162,142 |
| 2019 | $3,344 | $276,065 | $117,102 | $158,963 |
| 2018 | $3,126 | $270,652 | $114,806 | $155,846 |
| 2017 | $3,071 | $265,345 | $112,555 | $152,790 |
| 2016 | $3,029 | $260,142 | $110,348 | $149,794 |
| 2015 | $2,692 | $235,000 | $47,000 | $188,000 |
| 2014 | $2,214 | $191,000 | $38,000 | $153,000 |
Source: Public Records
Map
Nearby Homes
- 12076 Lager Rd
- 1 Duncan Rd
- 0 Duncan Rd Unit AR25272366
- 0 Duncan Rd Unit DW24122698
- 0 Duncan Rd Unit IV25267264
- 0 Del Rosa Rd Unit HD25155418
- 11676 Acanthus St
- 0 Schultz Rd
- 111 La Mirada Rd
- 759 La Mirada Rd
- 5272 Duncan Rd
- 2 Wilson Ranch Rd
- 0 W Wilson Ranch Rd Unit HD25177977
- 0 Sunset Rd Unit HD25093308
- 11524 Paramount Rd
- 6485 Sunset Rd
- 0 0 La Mesa Rd
- 5877 Goss Rd
- 0 Sequoia Rd Unit PW26040494
- 5132 Sunset Rd
- 12132 Schlitz Rd
- 5845 Duncan Rd
- 12129 Lager Rd
- 12187 Schlitz Rd
- 12168 Schlitz Rd
- 12173 Lager Rd
- 5277 Tokay St
- 0 Lager Rd Unit IV13115264
- 0 Lager Rd Unit IV13115244
- 0 Lager Rd Unit IV15145623
- 0 Lager Rd Unit IV16078626
- 0 Lager Rd Unit IV16163326
- 0 Lager Rd Unit IV16738948
- 0 Lager Rd Unit CRIV25041962
- 0 Lager Rd Unit CROC24040857
- 0 Lager Rd Unit CRIG24073543
- 0 Lager Rd Unit CROC24032068
- 0 Lager Rd Unit CRFR24254571
- 0 Lager Rd Unit FR24254571
- 0 Lager Rd Unit IG24073543
Your Personal Tour Guide
Ask me questions while you tour the home.