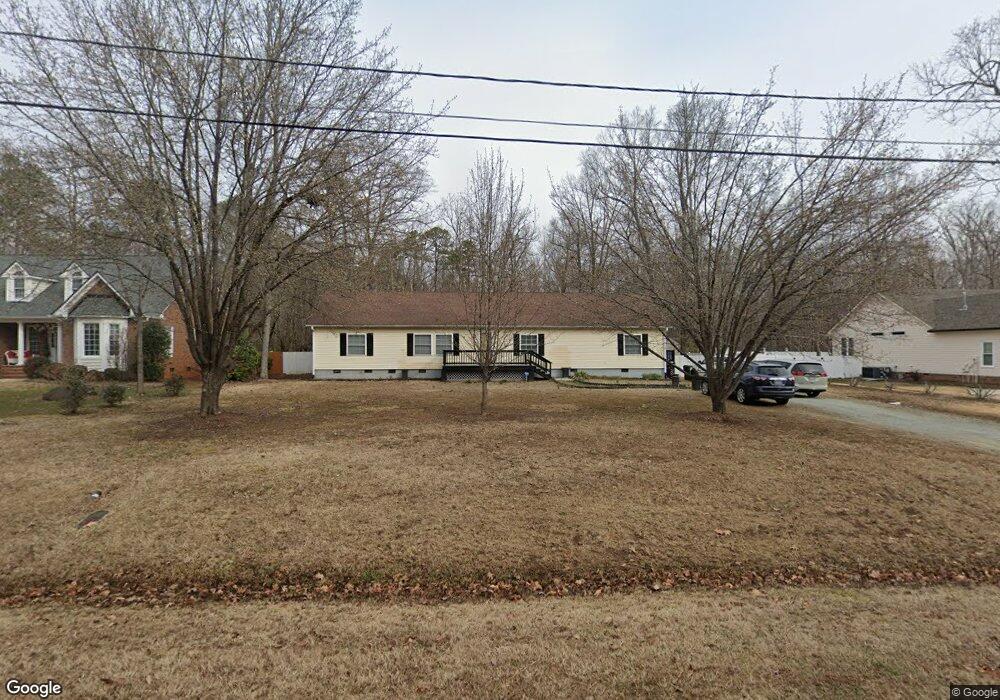
1209 Briardale Rd Durham, NC 27712
North Durham NeighborhoodEstimated Value: $405,000 - $458,000
3
Beds
3
Baths
2,044
Sq Ft
$212/Sq Ft
Est. Value
About This Home
This home is located at 1209 Briardale Rd, Durham, NC 27712 and is currently estimated at $432,604, approximately $211 per square foot. 1209 Briardale Rd is a home located in Durham County with nearby schools including Eno Valley Elementary, George L Carrington Middle, and Northern High School.
Ownership History
Date
Name
Owned For
Owner Type
Purchase Details
Closed on
Jul 18, 2020
Sold by
Graham Willie and Graham Phyllis
Bought by
Graham Willie B and Graham Phyllis N
Current Estimated Value
Home Financials for this Owner
Home Financials are based on the most recent Mortgage that was taken out on this home.
Original Mortgage
$163,691
Outstanding Balance
$145,420
Interest Rate
3.2%
Mortgage Type
FHA
Estimated Equity
$287,184
Purchase Details
Closed on
Jun 28, 2001
Sold by
Gray Arlene
Bought by
Graham Willie and Graham Phyllis
Home Financials for this Owner
Home Financials are based on the most recent Mortgage that was taken out on this home.
Original Mortgage
$151,793
Interest Rate
7.14%
Mortgage Type
FHA
Purchase Details
Closed on
Oct 20, 1997
Sold by
Hardin James E and Hardin Carolyn C
Bought by
Gray Arlene Jo
Home Financials for this Owner
Home Financials are based on the most recent Mortgage that was taken out on this home.
Original Mortgage
$91,076
Interest Rate
7.37%
Create a Home Valuation Report for This Property
The Home Valuation Report is an in-depth analysis detailing your home's value as well as a comparison with similar homes in the area
Home Values in the Area
Average Home Value in this Area
Purchase History
| Date | Buyer | Sale Price | Title Company |
|---|---|---|---|
| Graham Willie B | -- | Vylla Title Llc | |
| Graham Willie | $153,000 | -- | |
| Gray Arlene Jo | $29,000 | -- |
Source: Public Records
Mortgage History
| Date | Status | Borrower | Loan Amount |
|---|---|---|---|
| Open | Graham Willie B | $163,691 | |
| Closed | Graham Willie | $151,793 | |
| Previous Owner | Gray Arlene Jo | $91,076 |
Source: Public Records
Tax History
| Year | Tax Paid | Tax Assessment Tax Assessment Total Assessment is a certain percentage of the fair market value that is determined by local assessors to be the total taxable value of land and additions on the property. | Land | Improvement |
|---|---|---|---|---|
| 2025 | $2,898 | $405,631 | $89,700 | $315,931 |
| 2024 | $2,366 | $229,057 | $46,650 | $182,407 |
| 2023 | $2,243 | $229,057 | $46,650 | $182,407 |
| 2022 | $2,154 | $229,057 | $46,650 | $182,407 |
| 2021 | $1,941 | $229,057 | $46,650 | $182,407 |
| 2020 | $1,901 | $229,057 | $46,650 | $182,407 |
| 2019 | $1,901 | $229,057 | $46,650 | $182,407 |
| 2018 | $1,627 | $182,059 | $31,100 | $150,959 |
| 2017 | $1,608 | $182,059 | $31,100 | $150,959 |
| 2016 | $1,540 | $182,059 | $31,100 | $150,959 |
| 2015 | $1,903 | $196,065 | $39,020 | $157,045 |
| 2014 | $1,903 | $196,065 | $39,020 | $157,045 |
Source: Public Records
Map
Nearby Homes
- 631 Infinity Rd
- 6 Timbercreek Ct
- 7 Neptune Ct
- 11 Shelburn Ct
- 5100 Stardust Dr
- 5525 Glenoaks Dr
- 4802 Seterra Bend
- 5514 Earl Rd
- 4311 White Cliff Ln
- 1318 Torredge Rd
- 8 Osage Place
- 726 Torredge Rd
- 215 Cheryl Ave
- 115 Windermere Dr Unit 204
- 309 Smith Dr
- 829 Sandlewood Dr
- 1209 Snow Hill Rd
- 711 Valetta Rd
- 1201 Snow Hill Rd
- 530 Crievewood Dr
- 1215 Briardale Rd
- 1205 Briardale Rd
- 1219 Briardale Rd
- 5136 Kenwood Rd
- 5132 Kenwood Rd
- 1223 Briardale Rd
- 1223 Briardale Ln
- 1115 Briardale Rd
- 1227 Briardale Ln
- 1309 Shady Ln
- 1231 Briardale Ln
- 5126 Kenwood Rd
- 1312 Shady Ln
- 1227 Briardale Rd
- 1227 Briardale Rd
- 5139 Kenwood Rd
- 1230 Briardale Ln
- 1234 Briardale Ln
- 1109 Briardale Rd
- 1308 Shady Ln
Your Personal Tour Guide
Ask me questions while you tour the home.