Estimated Value: $152,604 - $190,000
4
Beds
2
Baths
1,830
Sq Ft
$95/Sq Ft
Est. Value
About This Home
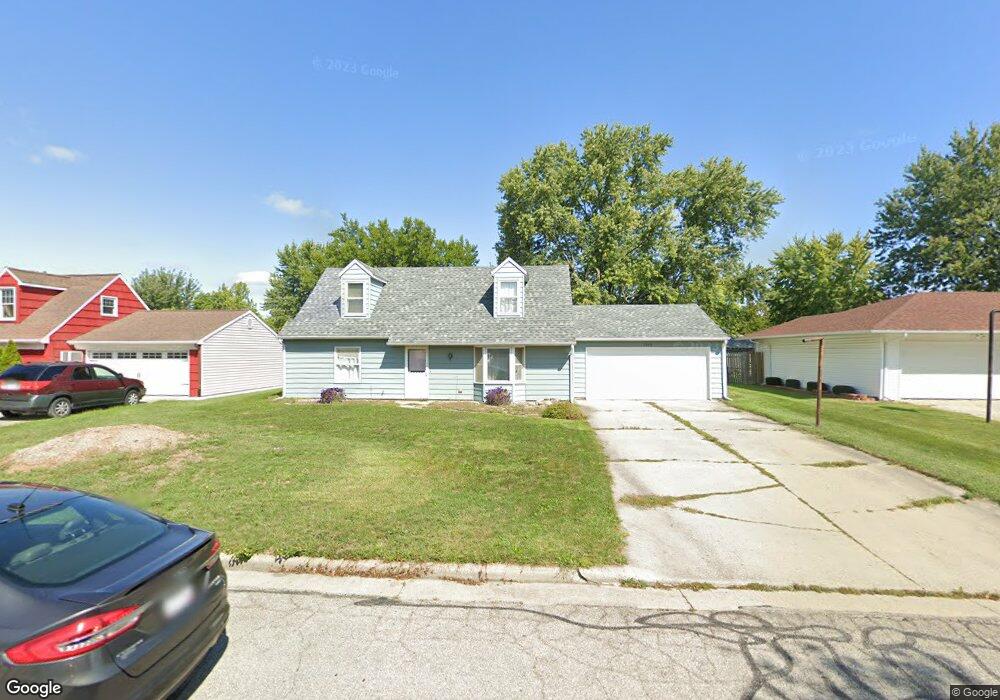
This home is located at 1209 Colonial Ln, Bryan, OH 43506 and is currently estimated at $174,151, approximately $95 per square foot. 1209 Colonial Ln is a home located in Williams County with nearby schools including Bryan Elementary PK-5, Washington Elementary School, and Bryan Middle School/High School.
Ownership History
Date
Name
Owned For
Owner Type
Purchase Details
Closed on
Jun 20, 2007
Sold by
Hopkins Karen S
Bought by
Hopkins Lyn B and Hopkins Lynn B
Current Estimated Value
Home Financials for this Owner
Home Financials are based on the most recent Mortgage that was taken out on this home.
Original Mortgage
$73,000
Outstanding Balance
$45,102
Interest Rate
6.37%
Mortgage Type
Purchase Money Mortgage
Estimated Equity
$129,049
Purchase Details
Closed on
Oct 27, 2006
Sold by
Rosendaul Helen L and Rosendaul Rex
Bought by
Hopkins Karen S
Home Financials for this Owner
Home Financials are based on the most recent Mortgage that was taken out on this home.
Original Mortgage
$35,128
Interest Rate
6.5%
Mortgage Type
Future Advance Clause Open End Mortgage
Purchase Details
Closed on
Jun 27, 1990
Bought by
Hopkins Lynn B and Hopkins Karen
Create a Home Valuation Report for This Property
The Home Valuation Report is an in-depth analysis detailing your home's value as well as a comparison with similar homes in the area
Home Values in the Area
Average Home Value in this Area
Purchase History
| Date | Buyer | Sale Price | Title Company |
|---|---|---|---|
| Hopkins Lyn B | -- | None Available | |
| Hopkins Karen S | $45,000 | None Available | |
| Hopkins Lynn B | $51,000 | -- |
Source: Public Records
Mortgage History
| Date | Status | Borrower | Loan Amount |
|---|---|---|---|
| Open | Hopkins Lyn B | $73,000 | |
| Closed | Hopkins Karen S | $35,128 |
Source: Public Records
Tax History Compared to Growth
Tax History
| Year | Tax Paid | Tax Assessment Tax Assessment Total Assessment is a certain percentage of the fair market value that is determined by local assessors to be the total taxable value of land and additions on the property. | Land | Improvement |
|---|---|---|---|---|
| 2024 | $1,452 | $42,460 | $6,060 | $36,400 |
| 2023 | $1,452 | $32,480 | $6,300 | $26,180 |
| 2022 | $1,601 | $32,480 | $6,300 | $26,180 |
| 2021 | $1,601 | $32,480 | $6,300 | $26,180 |
| 2020 | $1,376 | $27,060 | $5,250 | $21,810 |
| 2019 | $1,364 | $27,060 | $5,250 | $21,810 |
| 2018 | $1,362 | $27,060 | $5,250 | $21,810 |
| 2017 | $1,303 | $25,730 | $5,250 | $20,480 |
| 2016 | $1,245 | $25,730 | $5,250 | $20,480 |
| 2015 | $1,296 | $25,730 | $5,250 | $20,480 |
| 2014 | $1,296 | $25,730 | $5,250 | $20,480 |
| 2013 | $1,300 | $25,730 | $5,250 | $20,480 |
Source: Public Records
Map
Nearby Homes
- 1305 E Wilson St
- 1228 E Wilson St
- 1019 E Wilson St
- 1621 Colonial Ln
- 877 E High St
- 891 E Bryan St
- 206 Glen Arbor Dr
- 519 E Butler St
- 211 Huntington Dr
- 216 N Allen St
- 4547 County Road 1575
- 110 N Cherry St
- 316 E Mulberry St
- 4739 Williams County Road 15
- 422 S Main St
- 917 S Walnut St
- 0 Lynn St Unit 6110702
- 000 N Main St
- 726 S Lynn St
- 615 S Portland St
- 1205 Colonial Ln
- 1215 Colonial Ln
- 1210 Bavarian Ln
- 204 Auburn Ln
- 1206 Bavarian Ln
- 1201 Colonial Ln
- 1210 Colonial Ln
- 1202 Bavarian Ln
- 312 Auburn Ln
- 1206 Colonial Ln
- 215 Auburn Ln
- 1125 Colonial Ln
- 1202 Colonial Ln
- 1124 Bavarian Ln
- 205 Auburn Ln
- 311 Auburn Ln
- 1124 Colonial Ln
- 1119 Colonial Ln
- 1209 E Wilson St
- 1305 Colonial Ln