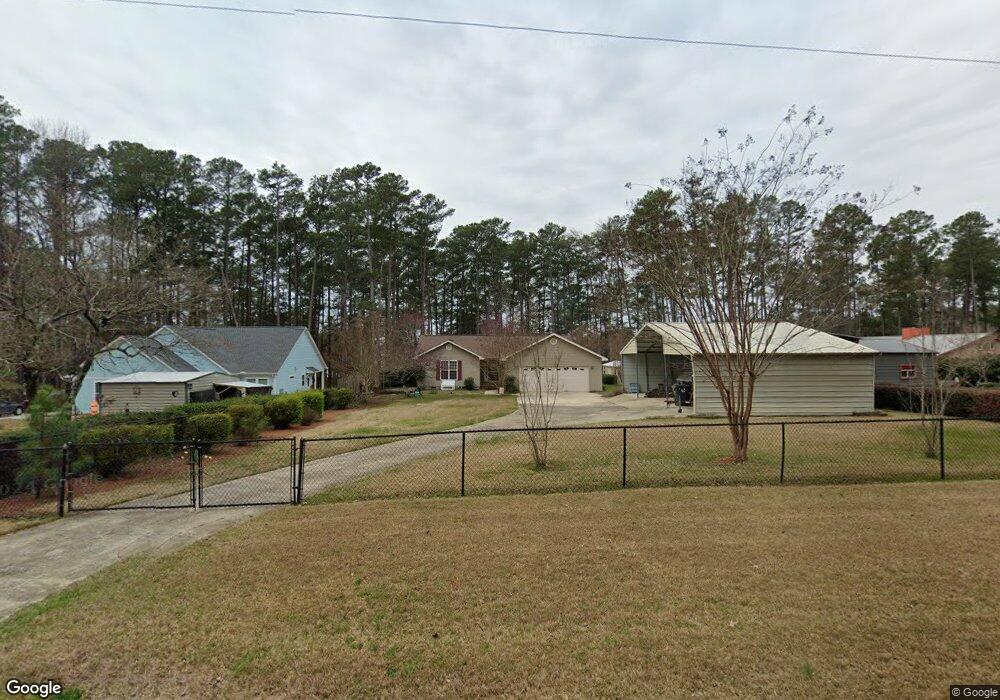
1209 Comanche Cir Lincolnton, GA 30817
Estimated Value: $342,422 - $474,000
3
Beds
2
Baths
1,166
Sq Ft
$344/Sq Ft
Est. Value
About This Home
This home is located at 1209 Comanche Cir, Lincolnton, GA 30817 and is currently estimated at $401,106, approximately $344 per square foot. 1209 Comanche Cir is a home located in Lincoln County with nearby schools including Lincoln County Elementary School, Lincoln County Middle School, and Lincoln County High School.
Ownership History
Date
Name
Owned For
Owner Type
Purchase Details
Closed on
Aug 1, 2019
Sold by
Prior Michael H
Bought by
Prior Michael H and Prior Donna Michelle
Current Estimated Value
Home Financials for this Owner
Home Financials are based on the most recent Mortgage that was taken out on this home.
Original Mortgage
$227,400
Outstanding Balance
$195,253
Interest Rate
3%
Mortgage Type
New Conventional
Estimated Equity
$205,853
Purchase Details
Closed on
Nov 22, 2004
Sold by
Yount Marc B and Yount Jacquelyn R
Bought by
Smith Bennon R and Smith Martha B
Purchase Details
Closed on
Jan 29, 2002
Sold by
Roberts Joyce B
Bought by
Yount Marc B and Yount Jacquelyn R
Purchase Details
Closed on
Jan 5, 1996
Sold by
Foster Nancy B
Bought by
Roberts Joyce B
Create a Home Valuation Report for This Property
The Home Valuation Report is an in-depth analysis detailing your home's value as well as a comparison with similar homes in the area
Home Values in the Area
Average Home Value in this Area
Purchase History
| Date | Buyer | Sale Price | Title Company |
|---|---|---|---|
| Prior Michael H | -- | -- | |
| Prior Michael H | $320,000 | -- | |
| Smith Bennon R | $178,000 | -- | |
| Yount Marc B | $163,900 | -- | |
| Roberts Joyce B | $35,200 | -- |
Source: Public Records
Mortgage History
| Date | Status | Borrower | Loan Amount |
|---|---|---|---|
| Open | Prior Michael H | $227,400 | |
| Closed | Prior Michael H | $227,400 |
Source: Public Records
Tax History Compared to Growth
Tax History
| Year | Tax Paid | Tax Assessment Tax Assessment Total Assessment is a certain percentage of the fair market value that is determined by local assessors to be the total taxable value of land and additions on the property. | Land | Improvement |
|---|---|---|---|---|
| 2025 | $3,484 | $130,640 | $38,400 | $92,240 |
| 2024 | $3,505 | $124,760 | $38,400 | $86,360 |
| 2023 | $2,880 | $109,520 | $38,400 | $71,120 |
| 2022 | $2,892 | $107,280 | $38,400 | $68,880 |
| 2021 | $3,019 | $101,680 | $38,400 | $63,280 |
| 2020 | $2,822 | $81,040 | $38,400 | $42,640 |
| 2019 | $218 | $81,040 | $38,400 | $42,640 |
| 2018 | $2,599 | $82,680 | $38,400 | $44,280 |
| 2017 | $2,179 | $69,320 | $32,000 | $37,320 |
| 2016 | $177 | $69,320 | $32,000 | $37,320 |
| 2015 | -- | $69,320 | $32,000 | $37,320 |
| 2014 | -- | $69,320 | $32,000 | $37,320 |
| 2013 | -- | $91,200 | $48,000 | $43,200 |
Source: Public Records
Map
Nearby Homes
- 1250 Mosley Rd
- 1025 Plantation Ln
- LOT 22 Plantation Point Rd
- 1203 Price Reese Rd
- 00 Bonner Rd
- 1102 Dogwood Dr
- 6710 Washington Rd
- 6075 Stb3 Ridge Rd
- 1063 Fleming Lk Ct
- 1063 Fleming Lake Ct
- 1080 Serenity Pointe Dr
- 6275 Ridge Rd
- Lot 1-E Ridge Rd
- LOT B Ridge Rd
- LOT C Ridge Rd
- 1164 Sally Ann Ct
- 4121 Pine Ridge Rd
- 1016 Hidden Lake Ct
- 0 Backway Rd
- 0 Ridge Rd
- 1219 Comanche Cir
- 1189 Comanche Cir
- 1229 Comanche Cir
- 0 Comanche Cir Unit 238010
- 6 Comanche Cir
- 13 Comanche Cir
- 0 Comanche Cir Unit 250208
- 0 Comanche Cir Unit 370638
- 0 Comanche Cir Unit 422625
- 0 Comanche Cir Unit 445029
- 4 Comanche Cir
- 10 Comanche Cir
- 9 Comanche Cir
- 0 Comanche Cir
- 1239 Comanche Cir
- 1212 Comanche Cir
- 1249 Comanche Cir
- 00 Mohican Ct
- 1250 Comanche Cir
- 1159 Comanche Cir