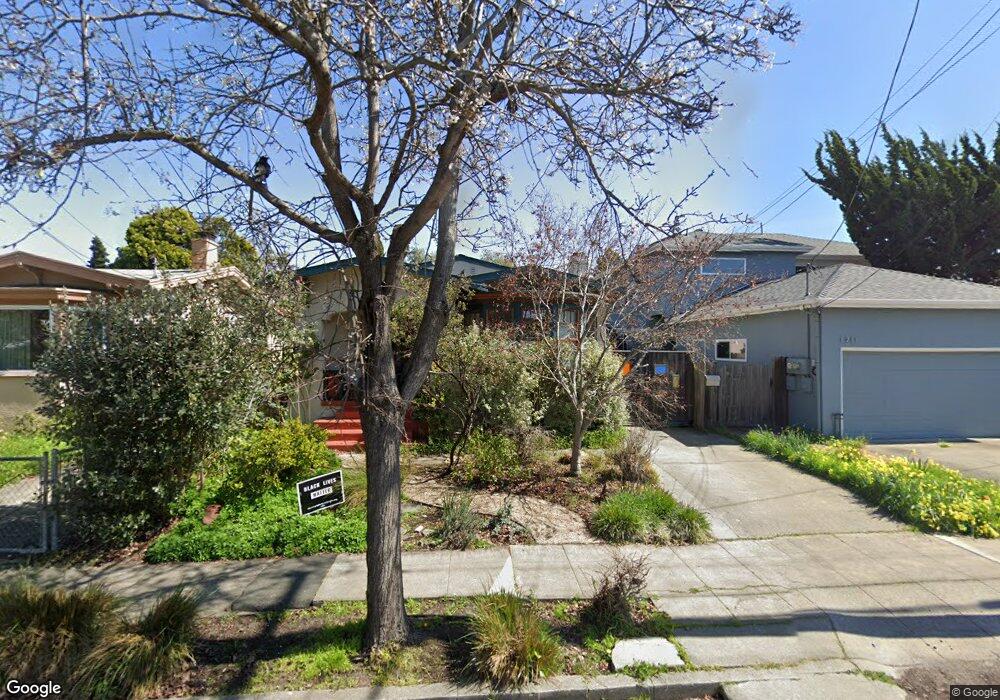
1209 Curtis St Albany, CA 94706
West Berkeley NeighborhoodEstimated Value: $1,149,000 - $1,497,000
3
Beds
2
Baths
1,288
Sq Ft
$1,013/Sq Ft
Est. Value
About This Home
This home is located at 1209 Curtis St, Albany, CA 94706 and is currently estimated at $1,304,274, approximately $1,012 per square foot. 1209 Curtis St is a home located in Alameda County with nearby schools including Ruth Acty Elementary, Thousand Oaks Elementary School, and Rosa Parks Elementary School.
Ownership History
Date
Name
Owned For
Owner Type
Purchase Details
Closed on
Jun 28, 2012
Sold by
Lever Christopher C and Lever Diane V
Bought by
Tams Joanna and Tams William
Current Estimated Value
Home Financials for this Owner
Home Financials are based on the most recent Mortgage that was taken out on this home.
Original Mortgage
$417,000
Outstanding Balance
$288,801
Interest Rate
3.74%
Mortgage Type
Purchase Money Mortgage
Estimated Equity
$1,015,473
Purchase Details
Closed on
Feb 17, 2009
Sold by
Lever Christopher C and Lever Diane V
Bought by
Lever Christopher C and Lever Diane V
Purchase Details
Closed on
Jul 10, 2003
Sold by
Paquin Jane S and Lopez Michael S
Bought by
Lever Christopher C and Lever Diane V
Home Financials for this Owner
Home Financials are based on the most recent Mortgage that was taken out on this home.
Original Mortgage
$322,700
Interest Rate
3.75%
Mortgage Type
Purchase Money Mortgage
Purchase Details
Closed on
Oct 15, 1998
Sold by
Lopez Carmen
Bought by
Lopez Carmen S and Carmen S Lopez 1998 Revocable
Create a Home Valuation Report for This Property
The Home Valuation Report is an in-depth analysis detailing your home's value as well as a comparison with similar homes in the area
Home Values in the Area
Average Home Value in this Area
Purchase History
| Date | Buyer | Sale Price | Title Company |
|---|---|---|---|
| Tams Joanna | $752,000 | Chicago Title Company | |
| Lever Christopher C | -- | None Available | |
| Lever Christopher C | $440,000 | Old Republic Title Company | |
| Lopez Carmen S | -- | -- |
Source: Public Records
Mortgage History
| Date | Status | Borrower | Loan Amount |
|---|---|---|---|
| Open | Tams Joanna | $417,000 | |
| Previous Owner | Lever Christopher C | $322,700 | |
| Closed | Lever Christopher C | $73,300 |
Source: Public Records
Tax History
| Year | Tax Paid | Tax Assessment Tax Assessment Total Assessment is a certain percentage of the fair market value that is determined by local assessors to be the total taxable value of land and additions on the property. | Land | Improvement |
|---|---|---|---|---|
| 2025 | $13,246 | $918,997 | $277,799 | $648,198 |
| 2024 | $13,246 | $900,844 | $272,353 | $635,491 |
| 2023 | $12,980 | $890,044 | $267,013 | $623,031 |
| 2022 | $12,768 | $865,597 | $261,779 | $610,818 |
| 2021 | $12,810 | $848,490 | $256,647 | $598,843 |
| 2020 | $12,182 | $846,721 | $254,016 | $592,705 |
| 2019 | $11,765 | $830,124 | $249,037 | $581,087 |
| 2018 | $11,581 | $813,851 | $244,155 | $569,696 |
| 2017 | $11,174 | $797,894 | $239,368 | $558,526 |
| 2016 | $10,857 | $782,252 | $234,675 | $547,577 |
| 2015 | $10,719 | $770,506 | $231,152 | $539,354 |
| 2014 | $10,660 | $755,413 | $226,624 | $528,789 |
Source: Public Records
Map
Nearby Homes
- 1120 Curtis St
- 1127 Key Route Blvd
- 1036 Ramona Ave
- 1329 Ordway St
- 1114 Talbot Ave
- 1498 Sonoma Ave
- 1339 Kains Ave
- 1626 Hopkins St
- 1136 Marin Ave
- 1741 Sonoma Ave
- 986 Kains Ave
- 1322 Virginia St
- 840 Key Route Blvd
- 1504 10th St
- 946 Kains Ave
- 1728 Curtis St
- 848 Stannage Ave Unit 11
- 1266 Washington Ave
- 753 Peralta Ave
- 995 Virginia St
- 1207 Curtis St
- 1213 Curtis St
- 1205 Curtis St
- 1217 Curtis St
- 1208 Neilson St
- 1206 Neilson St
- 1212 Neilson St
- 1204 Neilson St
- 1201 Curtis St
- 1219 Curtis St
- 1202 Neilson St
- 1216 Neilson St
- 1198 Curtis St
- 1202 Curtis St
- 1204 Curtis St
- 1200 Neilson St
- 1200 Curtis St
- 1206 Curtis St
- 1220 Neilson St
- 1221 Curtis St
Your Personal Tour Guide
Ask me questions while you tour the home.