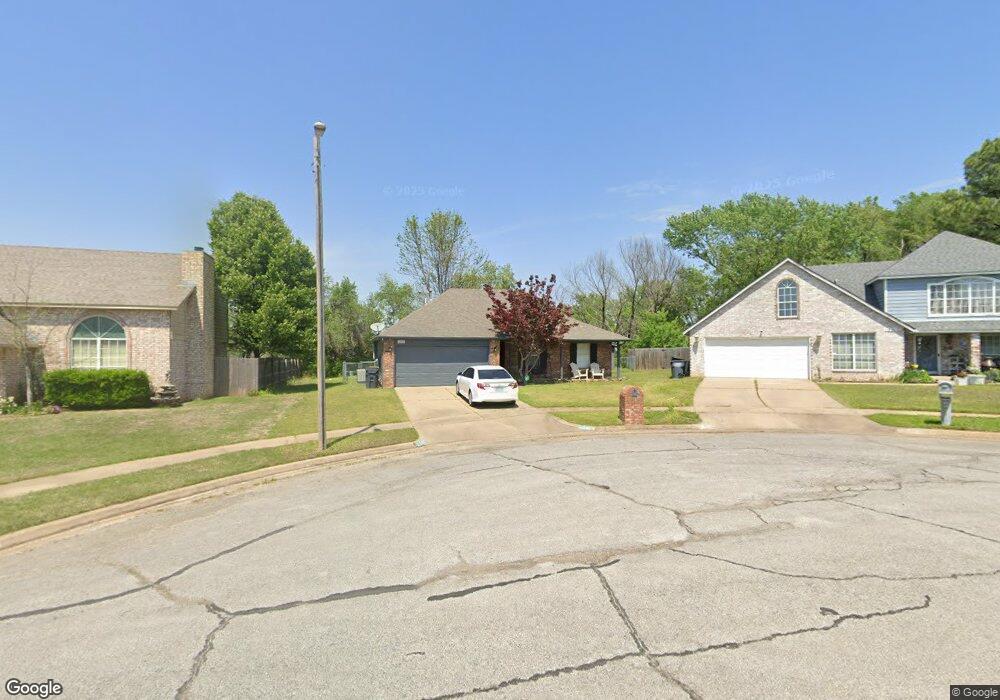
1209 E 132nd Place Glenpool, OK 74033
Estimated Value: $208,000 - $227,000
3
Beds
2
Baths
1,385
Sq Ft
$157/Sq Ft
Est. Value
About This Home
This home is located at 1209 E 132nd Place, Glenpool, OK 74033 and is currently estimated at $217,195, approximately $156 per square foot. 1209 E 132nd Place is a home located in Tulsa County with nearby schools including Glenpool Elementary School, Glenpool Middle School, and Glenpool High School.
Ownership History
Date
Name
Owned For
Owner Type
Purchase Details
Closed on
Feb 4, 2008
Sold by
Mortgage Clearing Corp
Bought by
Farmer Patrick and Farmer Tanya
Current Estimated Value
Purchase Details
Closed on
Mar 7, 2003
Sold by
Equity Investment Llc
Bought by
Walters James D and Walters Linda B
Home Financials for this Owner
Home Financials are based on the most recent Mortgage that was taken out on this home.
Original Mortgage
$90,000
Interest Rate
5.86%
Mortgage Type
Purchase Money Mortgage
Purchase Details
Closed on
Jan 17, 2003
Sold by
Dill Shari Lee and Dill Bobby Dale
Bought by
Equity Investments Llc
Home Financials for this Owner
Home Financials are based on the most recent Mortgage that was taken out on this home.
Original Mortgage
$90,000
Interest Rate
5.86%
Mortgage Type
Purchase Money Mortgage
Purchase Details
Closed on
Sep 1, 1996
Create a Home Valuation Report for This Property
The Home Valuation Report is an in-depth analysis detailing your home's value as well as a comparison with similar homes in the area
Home Values in the Area
Average Home Value in this Area
Purchase History
| Date | Buyer | Sale Price | Title Company |
|---|---|---|---|
| Farmer Patrick | $86,000 | First American Title & Abstr | |
| Walters James D | $106,000 | True Title & Escrow | |
| Equity Investments Llc | $97,000 | -- | |
| -- | $74,500 | -- |
Source: Public Records
Mortgage History
| Date | Status | Borrower | Loan Amount |
|---|---|---|---|
| Previous Owner | Walters James D | $90,000 | |
| Previous Owner | Equity Investments Llc | $77,136 |
Source: Public Records
Tax History
| Year | Tax Paid | Tax Assessment Tax Assessment Total Assessment is a certain percentage of the fair market value that is determined by local assessors to be the total taxable value of land and additions on the property. | Land | Improvement |
|---|---|---|---|---|
| 2025 | $1,404 | $11,709 | $1,289 | $10,420 |
| 2024 | $1,371 | $11,710 | $1,314 | $10,396 |
| 2023 | $1,371 | $12,710 | $1,473 | $11,237 |
| 2022 | $1,349 | $11,709 | $1,900 | $9,809 |
| 2021 | $1,370 | $11,709 | $1,900 | $9,809 |
| 2020 | $1,380 | $11,709 | $1,900 | $9,809 |
| 2019 | $1,390 | $11,709 | $1,900 | $9,809 |
| 2018 | $1,384 | $11,709 | $1,900 | $9,809 |
| 2017 | $1,354 | $12,709 | $2,062 | $10,647 |
| 2016 | $1,368 | $12,709 | $2,062 | $10,647 |
| 2015 | $1,321 | $12,709 | $2,062 | $10,647 |
| 2014 | $1,285 | $12,709 | $2,062 | $10,647 |
Source: Public Records
Map
Nearby Homes
- 1218 E 133rd Place
- 13294 S Maple St
- 1211 E 135th St
- 1309 E 135th St S
- 2355 E 135th Place
- 1159 E 137th St
- 1104 E 137th St
- 13761 S Nyssa Ct
- 13659 S Quincy St
- 1664 E 138th St S
- 13653 S Hickory Place
- 582 E 133rd Place
- 1671 E 140th St
- 13672 S Kenosha Ave
- 603 E 135th Place
- 1665 E 138th Place S
- 13816 S Iroquois Ave E
- 13605 S Owasso Ave
- 1655 E 139th Ct
- 13804 S Glen Place
- 1221 E 132nd Place
- 1197 E 132nd Place
- 1185 E 132nd Place
- 13261 S Oak Place
- 1173 E 132nd Place
- 1196 E 132nd Place
- 13273 S Oak Place
- 1184 E 132nd Place
- 1161 E 132nd Place
- 1172 E 132nd Place
- 13285 S Oak Place
- 138 E 131st St S
- 1149 E 132nd Place
- 1160 E 132nd Place
- 1195 E 133rd St
- 1183 E 133rd St
- 13297 S Oak Place
- 1148 E 132nd Place
- 13199 S Oak St
Your Personal Tour Guide
Ask me questions while you tour the home.