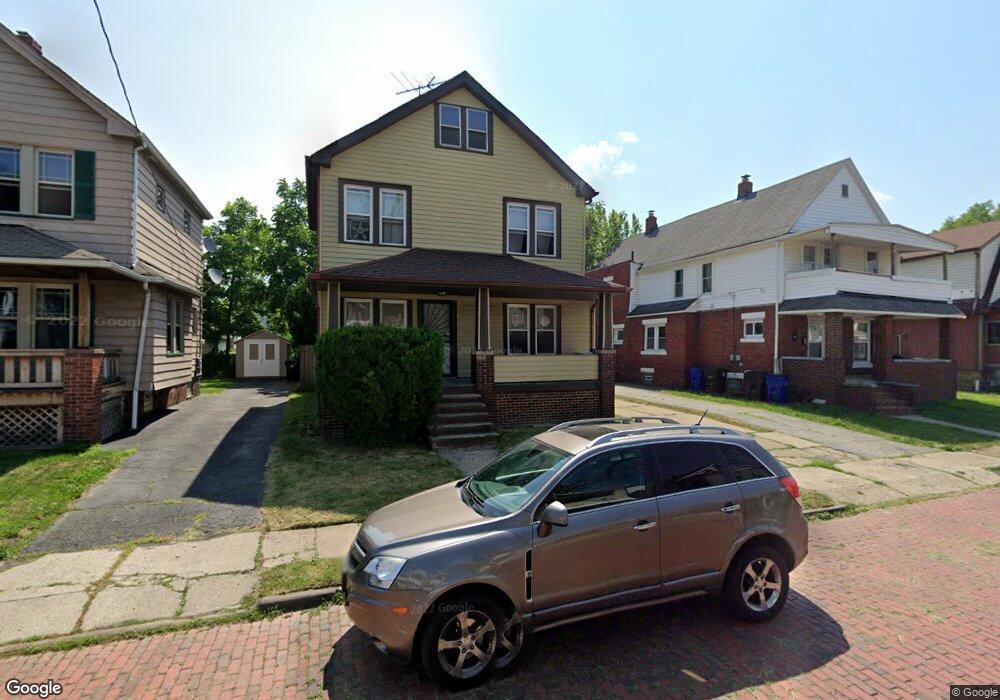
1209 E 173rd St Cleveland, OH 44119
North Collinwood NeighborhoodEstimated Value: $88,291 - $130,000
3
Beds
1
Bath
1,233
Sq Ft
$88/Sq Ft
Est. Value
About This Home
This home is located at 1209 E 173rd St, Cleveland, OH 44119 and is currently estimated at $108,573, approximately $88 per square foot. 1209 E 173rd St is a home located in Cuyahoga County with nearby schools including Lakeshore Intergenerational School, Imagine Bella Academy of Excellence, and Noble Academy-Cleveland.
Ownership History
Date
Name
Owned For
Owner Type
Purchase Details
Closed on
Aug 31, 2007
Sold by
Galant Sergio
Bought by
Adams Marcella L
Current Estimated Value
Home Financials for this Owner
Home Financials are based on the most recent Mortgage that was taken out on this home.
Original Mortgage
$80,698
Outstanding Balance
$49,906
Interest Rate
6.66%
Mortgage Type
VA
Estimated Equity
$58,667
Purchase Details
Closed on
Oct 31, 2006
Sold by
Deutsche Bank National Trust Co
Bought by
Galant Sergio
Purchase Details
Closed on
Mar 14, 2006
Sold by
Hobbs Kelli R
Bought by
Deutsche Bank National Trust Co
Purchase Details
Closed on
Sep 17, 1993
Sold by
Hodor Deborah J
Bought by
Hobbs Kelli R
Purchase Details
Closed on
May 17, 1979
Sold by
Sophy L Hodor
Bought by
Hodor Deborah J
Purchase Details
Closed on
Nov 15, 1977
Sold by
Hodor John C
Bought by
Sophy L Hodor
Purchase Details
Closed on
May 6, 1976
Sold by
Barry William T and Barry Linda M
Bought by
Hodor John C
Purchase Details
Closed on
Jan 1, 1975
Bought by
Barry William T and Barry Linda M
Create a Home Valuation Report for This Property
The Home Valuation Report is an in-depth analysis detailing your home's value as well as a comparison with similar homes in the area
Home Values in the Area
Average Home Value in this Area
Purchase History
| Date | Buyer | Sale Price | Title Company |
|---|---|---|---|
| Adams Marcella L | $79,000 | Executive Title Agency | |
| Galant Sergio | $18,095 | Sovereign Title Agenc | |
| Deutsche Bank National Trust Co | $33,334 | Attorney | |
| Hobbs Kelli R | $48,900 | -- | |
| Hodor Deborah J | -- | -- | |
| Sophy L Hodor | -- | -- | |
| Hodor John C | $28,000 | -- | |
| Barry William T | -- | -- |
Source: Public Records
Mortgage History
| Date | Status | Borrower | Loan Amount |
|---|---|---|---|
| Open | Adams Marcella L | $80,698 |
Source: Public Records
Tax History
| Year | Tax Paid | Tax Assessment Tax Assessment Total Assessment is a certain percentage of the fair market value that is determined by local assessors to be the total taxable value of land and additions on the property. | Land | Improvement |
|---|---|---|---|---|
| 2025 | $1,584 | $24,150 | $4,620 | $19,530 |
| 2024 | $1,583 | $24,150 | $4,620 | $19,530 |
| 2023 | $1,102 | $14,530 | $3,220 | $11,310 |
| 2022 | $1,096 | $14,530 | $3,220 | $11,310 |
| 2021 | $1,085 | $14,530 | $3,220 | $11,310 |
| 2020 | $1,101 | $12,740 | $2,840 | $9,910 |
| 2019 | $1,018 | $36,400 | $8,100 | $28,300 |
| 2018 | $1,015 | $12,740 | $2,840 | $9,910 |
| 2017 | $1,184 | $14,360 | $2,700 | $11,660 |
| 2016 | $1,175 | $14,360 | $2,700 | $11,660 |
| 2015 | $1,354 | $14,360 | $2,700 | $11,660 |
| 2014 | $1,354 | $16,490 | $3,120 | $13,370 |
Source: Public Records
Map
Nearby Homes
- 1241 E 173rd St
- 1193 E 172nd St
- 17216 Grovewood Ave
- 16918 Grovewood Ave
- 1239 E 168th St
- 1140 E 169th St
- 1113 E 177th St
- 1109 E 169th St
- 1128 E 168th St
- 1077 E 169th St
- 1228 E 167th St
- 16215 Huntmere Ave
- 16204 Arcade Ave
- 16110 Huntmere Ave
- 983 E 179th St
- 17633 Wildwood Ln Unit 311
- 17639 Wildwood Ln Unit 17639
- 1426 E 175th St
- 1311 E 187th St
- 15901 Pythias Ave
- 1205 E 173rd St
- 1213 E 173rd St
- 1175 E 173rd St
- 1201 E 173rd St
- 1219 E 173rd St
- 1210 E 175th St
- 1208 E 175th St
- 1216 E 175th St
- 1202 E 175th St
- 1197 E 173rd St
- 1223 E 173rd St
- 1220 E 175th St
- 1208 E 173rd St
- 1204 E 173rd St
- 1204 E 173rd St Unit UP
- 1204 E 173rd St Unit down
- 1212 E 173rd St
- 1198 E 175th St
- 1200 E 173rd St
- 1216 E 173rd St
Your Personal Tour Guide
Ask me questions while you tour the home.