Estimated Value: $533,000 - $666,000
5
Beds
3
Baths
2,464
Sq Ft
$240/Sq Ft
Est. Value
About This Home
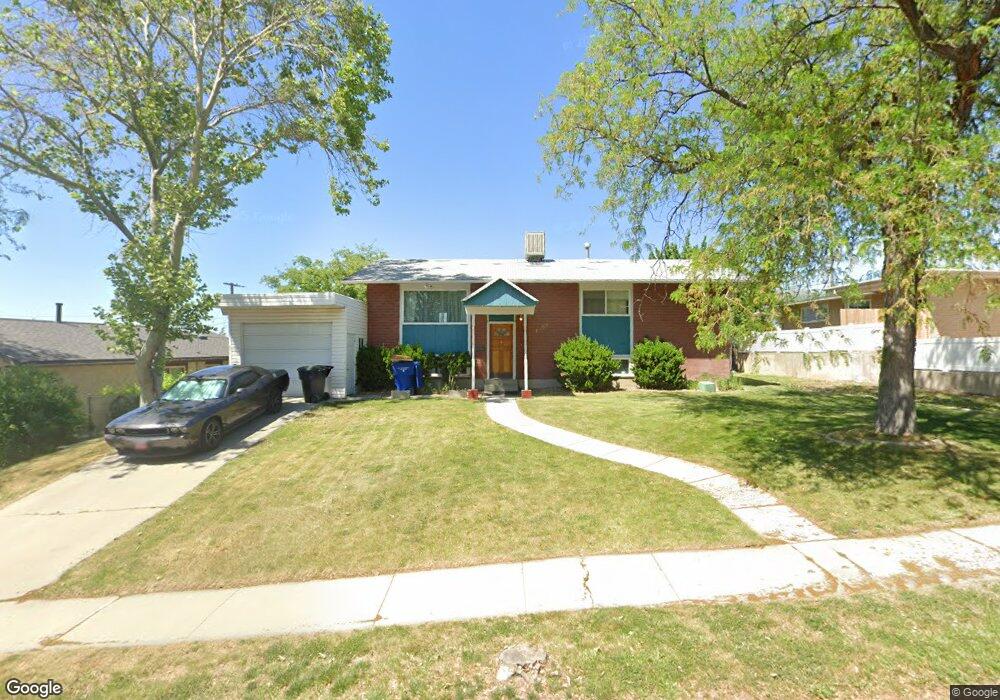
This home is located at 1209 E Forget me Not Ave, Sandy, UT 84094 and is currently estimated at $591,477, approximately $240 per square foot. 1209 E Forget me Not Ave is a home located in Salt Lake County with nearby schools including Eastmont Middle School, Jordan High, and Challenger School - Sandy.
Ownership History
Date
Name
Owned For
Owner Type
Purchase Details
Closed on
Mar 10, 2023
Sold by
Daniel And Christine Grings Trust
Bought by
Wu Meng and Li Zhongxin
Current Estimated Value
Purchase Details
Closed on
Apr 16, 2021
Sold by
Grings Daniel and Grings Christine
Bought by
Grings Daniel and Grings Christine
Purchase Details
Closed on
Dec 21, 1998
Sold by
Bateman Randall B
Bought by
Grings Daniel and Grings Christine
Home Financials for this Owner
Home Financials are based on the most recent Mortgage that was taken out on this home.
Original Mortgage
$127,275
Interest Rate
6.91%
Purchase Details
Closed on
May 16, 1994
Sold by
Covington Stephen J
Bought by
Bateman Randall B
Purchase Details
Closed on
Jan 26, 1994
Sold by
Covington Stephen
Bought by
Bateman Randall B
Home Financials for this Owner
Home Financials are based on the most recent Mortgage that was taken out on this home.
Original Mortgage
$100,322
Interest Rate
7.21%
Mortgage Type
FHA
Create a Home Valuation Report for This Property
The Home Valuation Report is an in-depth analysis detailing your home's value as well as a comparison with similar homes in the area
Home Values in the Area
Average Home Value in this Area
Purchase History
| Date | Buyer | Sale Price | Title Company |
|---|---|---|---|
| Wu Meng | -- | Steed Title | |
| Grings Daniel | -- | None Available | |
| Grings Daniel | -- | Associated Title | |
| Bateman Randall B | -- | -- | |
| Bateman Randall B | -- | -- |
Source: Public Records
Mortgage History
| Date | Status | Borrower | Loan Amount |
|---|---|---|---|
| Previous Owner | Grings Daniel | $127,275 | |
| Previous Owner | Bateman Randall B | $100,322 |
Source: Public Records
Tax History
| Year | Tax Paid | Tax Assessment Tax Assessment Total Assessment is a certain percentage of the fair market value that is determined by local assessors to be the total taxable value of land and additions on the property. | Land | Improvement |
|---|---|---|---|---|
| 2025 | $3,652 | $505,600 | $130,100 | $375,500 |
| 2024 | $3,652 | $489,200 | $121,500 | $367,700 |
| 2023 | $3,103 | $444,900 | $115,600 | $329,300 |
| 2022 | $3,134 | $453,900 | $113,300 | $340,600 |
| 2021 | $2,657 | $336,800 | $88,100 | $248,700 |
| 2020 | $2,650 | $307,700 | $88,100 | $219,600 |
| 2019 | $2,480 | $285,100 | $83,100 | $202,000 |
| 2016 | $2,105 | $216,300 | $83,100 | $133,200 |
Source: Public Records
Map
Nearby Homes
- 1123 E Sego Lily Dr
- 1420 E Firelight Way
- 10517 S Larkspur Dr
- 1062 E Diamond Way
- 10172 Snow Iris Way
- 9976 Tamara St E
- 9968 S Blossom Dr
- 10538 S Bay Meadow Dr
- 10366 S Larkspur Cir
- 954 E Carnation Dr
- 941 E Carnation Dr
- 1119 E 10600 S
- 10240 Locksley Rd
- 10642 S 1090 E
- 10673 S Bridlewood Ln
- 1602 E Sego Lily Dr
- 10158 Buttercup Dr
- 845 Larkspur Dr
- 1650 E Budding Dr
- 9971 Pinehurst Dr
- 1209 Forget me Not Ave
- 1219 Forget me Not Ave
- 1201 Forget me Not Ave
- 1212 E Sego Lily Dr
- 1218 E Sego Lily Dr
- 1208 Sego Lily Dr
- 1218 Sego Lily Dr
- 1225 Forget me Not Ave
- 1191 Forget me Not Ave
- 1212 Sego Lily Dr
- 1191 E Forget me Not Ave
- 10243 Marble St
- 1212 E Forget me Not Ave
- 1212 Forget me Not Ave
- 1204 Forget me Not Ave
- 1218 Forget me Not Ave
- 1226 E Sego Lily Dr
- 1196 Forget me Not Ave
- 1196 E Forget me Not Ave
- 1226 Sego Lily Dr
Your Personal Tour Guide
Ask me questions while you tour the home.