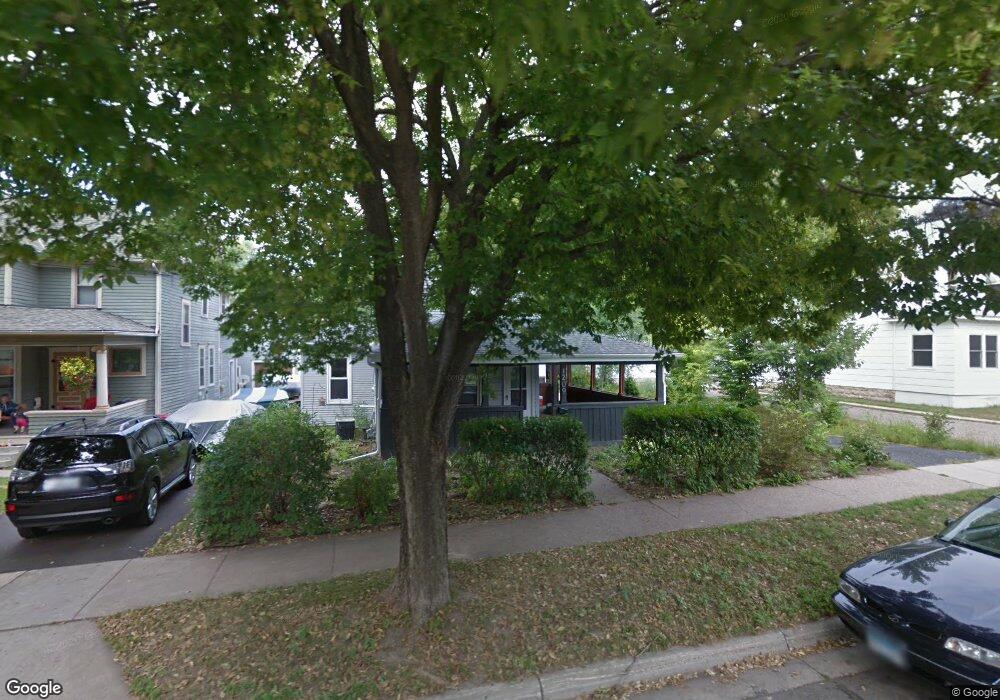
1209 East Ave Red Wing, MN 55066
Estimated Value: $218,000 - $242,000
4
Beds
1
Bath
1,196
Sq Ft
$192/Sq Ft
Est. Value
About This Home
This home is located at 1209 East Ave, Red Wing, MN 55066 and is currently estimated at $229,325, approximately $191 per square foot. 1209 East Ave is a home located in Goodhue County with nearby schools including Sunnyside Elementary School, Burnside Elementary School, and Twin Bluff Middle School.
Ownership History
Date
Name
Owned For
Owner Type
Purchase Details
Closed on
Jun 23, 2017
Sold by
Bewick Sheree
Bought by
Howe Cody Leroy and Huppert Whitney Jo
Current Estimated Value
Purchase Details
Closed on
Nov 29, 2006
Sold by
Not Provided
Bought by
Bewick Sheree M
Purchase Details
Closed on
Sep 22, 2004
Sold by
Harstad Jeremy and Harstad Stacey M
Bought by
Anderson Chad M and Anderson Courtney J
Purchase Details
Closed on
May 23, 2000
Sold by
Salomon Brothers Mtg Securities Vii Inc
Bought by
Harstad Jeremy J and Harstad Stacey M
Create a Home Valuation Report for This Property
The Home Valuation Report is an in-depth analysis detailing your home's value as well as a comparison with similar homes in the area
Home Values in the Area
Average Home Value in this Area
Purchase History
| Date | Buyer | Sale Price | Title Company |
|---|---|---|---|
| Howe Cody Leroy | $124,500 | None Available | |
| Bewick Sheree M | $109,500 | -- | |
| Anderson Chad M | $139,050 | -- | |
| Harstad Jeremy J | $85,000 | -- |
Source: Public Records
Tax History Compared to Growth
Tax History
| Year | Tax Paid | Tax Assessment Tax Assessment Total Assessment is a certain percentage of the fair market value that is determined by local assessors to be the total taxable value of land and additions on the property. | Land | Improvement |
|---|---|---|---|---|
| 2025 | $1,970 | $174,200 | $35,600 | $138,600 |
| 2024 | $1,970 | $172,300 | $35,600 | $136,700 |
| 2023 | $1,005 | $163,000 | $35,600 | $127,400 |
| 2022 | $1,792 | $161,800 | $35,600 | $126,200 |
| 2021 | $1,650 | $140,600 | $35,600 | $105,000 |
| 2020 | $1,632 | $132,800 | $35,600 | $97,200 |
| 2019 | $1,604 | $124,500 | $35,600 | $88,900 |
| 2018 | $1,260 | $124,000 | $34,200 | $89,800 |
| 2017 | $1,232 | $109,700 | $34,200 | $75,500 |
| 2016 | $1,132 | $108,800 | $34,200 | $74,600 |
| 2015 | $1,082 | $105,900 | $34,200 | $71,700 |
| 2014 | -- | $101,900 | $34,200 | $67,700 |
Source: Public Records
Map
Nearby Homes
- 1218 East Ave
- 1109 East Ave
- 466 14th St
- 516 Norwood St
- 1416 Phelps St
- 1524 Bush St
- 759 Plum St
- 1547 Bush St
- 924 Central Ave
- 737 McSorley St
- 716 Central Ave
- 642 Grace St
- 1218 Central Ave
- XXXX Skyline Heights
- 802 West Ave
- 523 East Ave Unit 211
- 523 East Ave Unit 213
- 613 Potter St
- 528 20th St
- 1012 West Ave