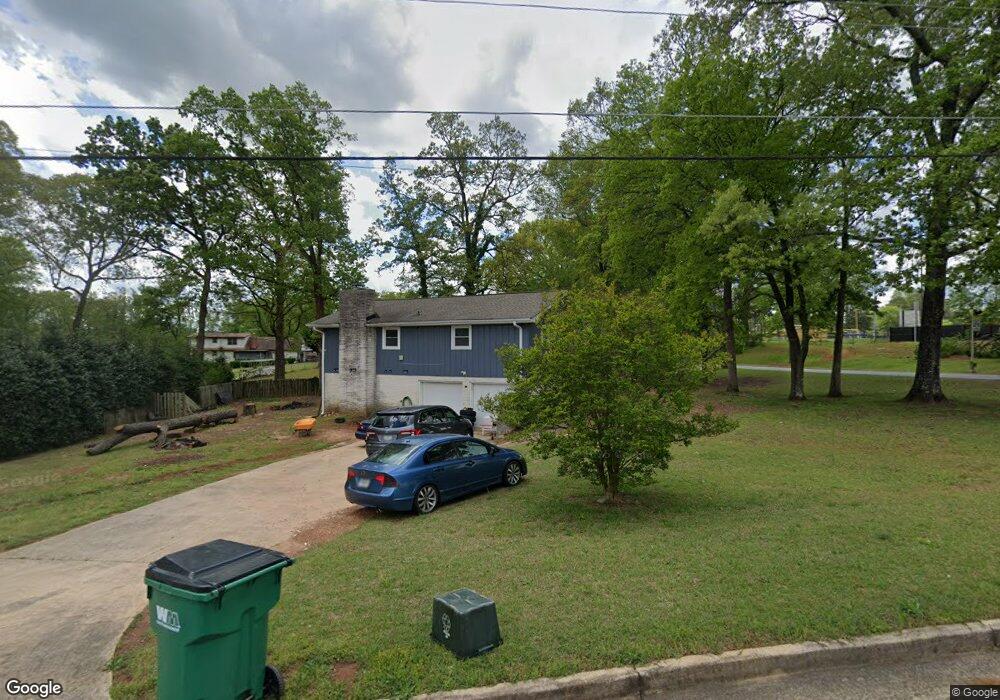
1209 Kenyon Rd Morrow, GA 30260
Estimated Value: $229,506 - $282,000
About This Home
This home is located at 1209 Kenyon Rd, Morrow, GA 30260 and is currently estimated at $252,127, approximately $119 per square foot. 1209 Kenyon Rd is a home located in Clayton County with nearby schools including Lake City Elementary School, Babb Middle School, and Forest Park High School.
Ownership History
We collect this data history from publicly available records. To have your information removed, we recommend requesting removal directly through your county’s website.
Purchase Details
Home Financials for this Owner
Home Financials are based on the most recent Mortgage that was taken out on this home.Purchase Details
Purchase Details
Home Financials for this Owner
Home Financials are based on the most recent Mortgage that was taken out on this home.Home Values in the Area
Average Home Value in this Area
Purchase History
We collect this data history from publicly available records. To have your information removed, we recommend requesting removal directly through your county’s website.
| Date | Buyer | Sale Price | Title Company |
|---|---|---|---|
| $118,000 | -- | ||
| $61,501 | -- | ||
| $140,000 | -- |
Mortgage History
We collect this data history from publicly available records. To have your information removed, we recommend requesting removal directly through your county’s website.
| Date | Status | Borrower | Loan Amount |
|---|---|---|---|
| Open | $80,000 | ||
| Previous Owner | $133,000 |
Tax History
We collect this data history from publicly available records. To have your information removed, we recommend requesting removal directly through your county’s website.
| Year | Tax Paid | Tax Assessment Tax Assessment Total Assessment is a certain percentage of the fair market value that is determined by local assessors to be the total taxable value of land and additions on the property. | Land | Improvement |
|---|---|---|---|---|
| 2025 | $3,043 | $79,000 | $8,800 | $70,200 |
| 2024 | $2,458 | $73,000 | $8,800 | $64,200 |
| 2023 | $2,673 | $74,040 | $8,800 | $65,240 |
| 2022 | $1,771 | $55,120 | $8,800 | $46,320 |
| 2021 | $1,605 | $50,640 | $8,800 | $41,840 |
| 2020 | $1,575 | $49,385 | $8,800 | $40,585 |
| 2019 | $1,474 | $46,308 | $6,400 | $39,908 |
| 2018 | $1,815 | $44,700 | $6,400 | $38,300 |
| 2017 | $1,559 | $38,312 | $6,400 | $31,912 |
| 2016 | $1,027 | $38,782 | $6,400 | $32,382 |
| 2015 | $1,024 | $0 | $0 | $0 |
| 2014 | $1,283 | $46,862 | $6,400 | $40,462 |
Map
- 1241 Tsali Trail
- 5489 Reynolds Rd
- 1112 Reynolds Ct Unit 4
- 1106 Reynolds Ct
- 1103 Reynolds Ct
- 5489 Ahyoka Dr
- 1077 Helen St
- 0 Metcalf Rd
- 98 Werner Brook Way SW
- 5452 Alder Dr
- 5535 Cypress Dr
- 5066 Phillips Dr
- 5316 Ash St
- 0 Ash St Unit 10563129
- 5570 Ash St
- 965 Cone Rd
- 774 Linda Way
- 1200 Burbank Trail
- 1124 Ponderosa Park Dr
- 740 Patricia Dr
- 1221 Kenyon Rd
- 5424 White Dr
- 1231 Kenyon Rd
- 1208 Tsali Trail
- 1220 Tsali Trail
- 1241 Kenyon Rd Unit 1
- 1230 Tsali Trail
- 1225 Sanders Way
- 1187 Sanders Way
- 1201 Sanders Way
- 1211 Sanders Way
- 1233 Sanders Way Unit 2
- 1217 Sanders Way
- 1195 Sanders Way Unit 2
- 1240 Tsali Trail
- 1179 Sanders Way Unit 2
- 1249 Kenyon Rd Unit 1
- 1241 Sanders Way
- 1171 Sanders Way
- 1207 Tsali Trail
Ask me questions while you tour the home.