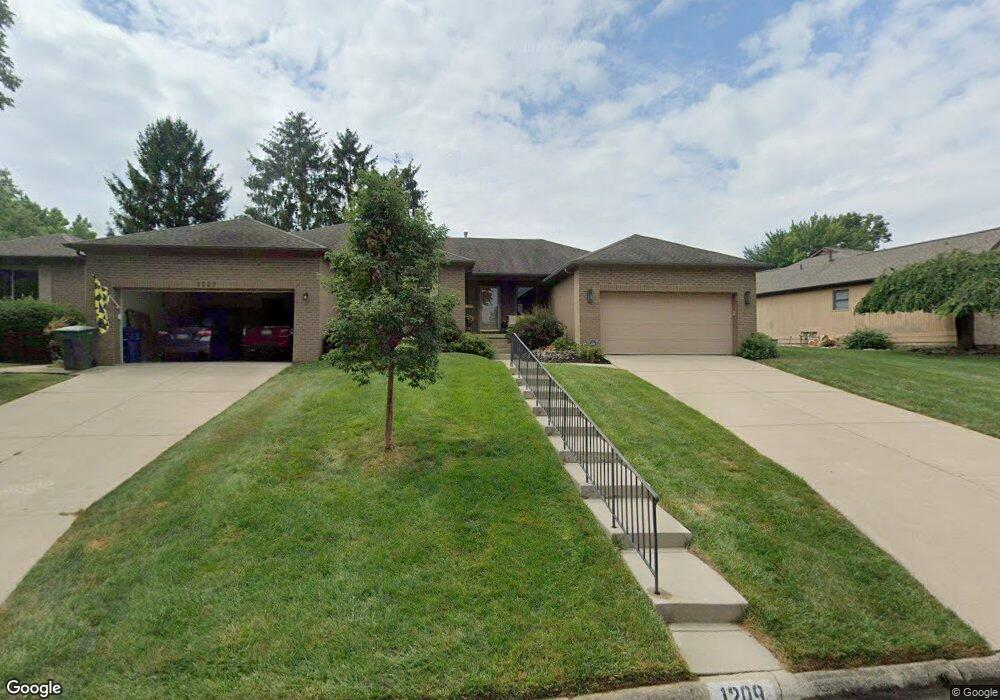
1209 Langland Dr Unit 1209 Columbus, OH 43220
Knolls West NeighborhoodEstimated Value: $282,454 - $385,000
2
Beds
2
Baths
1,490
Sq Ft
$209/Sq Ft
Est. Value
About This Home
This home is located at 1209 Langland Dr Unit 1209, Columbus, OH 43220 and is currently estimated at $311,864, approximately $209 per square foot. 1209 Langland Dr Unit 1209 is a home located in Franklin County with nearby schools including Winterset Elementary School, Ridgeview Middle School, and Centennial High School.
Ownership History
Date
Name
Owned For
Owner Type
Purchase Details
Closed on
Apr 22, 2008
Sold by
Patton Jeannette E and Chandler Larry B
Bought by
Patton Jeannette E and Chandler Larry B
Current Estimated Value
Purchase Details
Closed on
Mar 31, 2004
Sold by
Smith Samuel H and Samuel H Smith Trust
Bought by
Patton Jeannette E
Purchase Details
Closed on
Jul 8, 2002
Sold by
Smith Samuel H and Smith Nancy N
Bought by
Smith Samuel H and Smith Nancy N
Purchase Details
Closed on
Apr 1, 2001
Sold by
Francisco John J
Bought by
Smith Samuel H and Smith Nancy N
Home Financials for this Owner
Home Financials are based on the most recent Mortgage that was taken out on this home.
Original Mortgage
$101,700
Interest Rate
7.03%
Purchase Details
Closed on
Dec 15, 1999
Sold by
Francisco John J
Bought by
Declaration Francisco Jr John and Declaration John Francisco Jr
Create a Home Valuation Report for This Property
The Home Valuation Report is an in-depth analysis detailing your home's value as well as a comparison with similar homes in the area
Home Values in the Area
Average Home Value in this Area
Purchase History
| Date | Buyer | Sale Price | Title Company |
|---|---|---|---|
| Patton Jeannette E | -- | Attorney | |
| Patton Jeannette E | $175,000 | -- | |
| Smith Samuel H | -- | -- | |
| Smith Samuel H | $154,000 | Chicago Title | |
| Declaration Francisco Jr John | -- | -- |
Source: Public Records
Mortgage History
| Date | Status | Borrower | Loan Amount |
|---|---|---|---|
| Previous Owner | Smith Samuel H | $101,700 | |
| Closed | Patton Jeannette E | $0 |
Source: Public Records
Tax History Compared to Growth
Tax History
| Year | Tax Paid | Tax Assessment Tax Assessment Total Assessment is a certain percentage of the fair market value that is determined by local assessors to be the total taxable value of land and additions on the property. | Land | Improvement |
|---|---|---|---|---|
| 2024 | $3,238 | $81,940 | $21,000 | $60,940 |
| 2023 | $3,224 | $81,935 | $21,000 | $60,935 |
| 2022 | $3,028 | $67,140 | $12,080 | $55,060 |
| 2021 | $3,034 | $67,140 | $12,080 | $55,060 |
| 2020 | $3,038 | $67,140 | $12,080 | $55,060 |
| 2019 | $3,011 | $58,380 | $10,500 | $47,880 |
| 2018 | $2,744 | $58,380 | $10,500 | $47,880 |
| 2017 | $2,872 | $58,380 | $10,500 | $47,880 |
| 2016 | $2,736 | $50,050 | $8,750 | $41,300 |
| 2015 | $2,484 | $50,050 | $8,750 | $41,300 |
| 2014 | $2,490 | $50,050 | $8,750 | $41,300 |
| 2013 | $1,228 | $50,050 | $8,750 | $41,300 |
Source: Public Records
Map
Nearby Homes
- 1147 Langland Dr
- 1161 Bethel Rd Unit 103/104
- 1213 Nantucket Ave
- 1466 Weybridge Rd
- 4710 Charecote Ln Unit D
- 5016 Postlewaite Rd Unit 5016
- 4818 -4820 Winterset Dr
- 1246 Southport Dr
- 1046 Merrimar Cir N Unit B
- 1558 Denbigh Dr
- 5363 Godown Rd
- 1030 Galliton Ct Unit B
- 1540 Slade Ave Unit 303
- 5111 Portland St
- 5485 Millington Rd
- 5111 Schuylkill St
- 928 Linworth Village Dr
- 1739 Paula Dr Unit 1739
- 4543 Ducrest Dr
- 895 Linworth Village Dr
- 1207 Langland Dr Unit 1207
- 1219-1221 Langland Dr
- 1219 Langland Dr Unit 221
- 5043 Cheviot Dr Unit 5043
- 5041 Cheviot Dr Unit 5041
- 0 Langland Dr
- 1200 Langland Dr
- 1192 Langland Dr
- 1210 Langland Dr
- 1212 Cheviot Ct Unit 214
- 1233 Langland Dr
- 1171 Langland Dr
- 1200 Cheviot Ct Unit 202
- 1180 Langland Dr
- 5046 Cheviot Dr
- 1235 Langland Dr
- 1218 Langland Dr Unit 16
- 5038 Cheviot Dr
- 1172 Langland Dr
- 5088 Dalmeny Ct