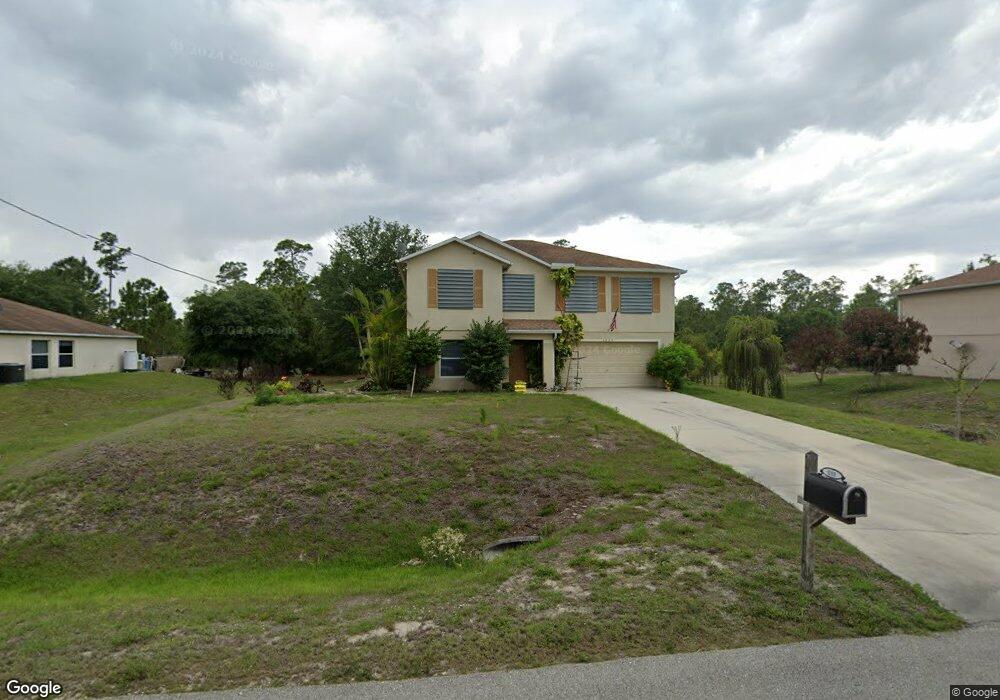
1209 Maple Ave N Lehigh Acres, FL 33972
Joel NeighborhoodEstimated Value: $251,000 - $411,000
3
Beds
3
Baths
2,538
Sq Ft
$126/Sq Ft
Est. Value
About This Home
This home is located at 1209 Maple Ave N, Lehigh Acres, FL 33972 and is currently estimated at $319,326, approximately $125 per square foot. 1209 Maple Ave N is a home located in Lee County with nearby schools including Lehigh Elementary School, The Alva School, and Gateway Elementary School.
Ownership History
Date
Name
Owned For
Owner Type
Purchase Details
Closed on
May 11, 2010
Sold by
Us Bank National Association
Bought by
Yuhasz Gary F and Yuhasz Shirley A
Current Estimated Value
Purchase Details
Closed on
Dec 29, 2009
Sold by
Cavalletti Francesco
Bought by
Us Bank National Association
Purchase Details
Closed on
Jul 12, 2005
Sold by
Tamarack North Realty Llc
Bought by
Cavalletti Francesco
Home Financials for this Owner
Home Financials are based on the most recent Mortgage that was taken out on this home.
Original Mortgage
$305,521
Interest Rate
5.51%
Mortgage Type
Construction
Purchase Details
Closed on
Dec 27, 2004
Sold by
Alston Lesten
Bought by
Vacca John
Home Financials for this Owner
Home Financials are based on the most recent Mortgage that was taken out on this home.
Original Mortgage
$31,000
Interest Rate
6.87%
Mortgage Type
Unknown
Create a Home Valuation Report for This Property
The Home Valuation Report is an in-depth analysis detailing your home's value as well as a comparison with similar homes in the area
Home Values in the Area
Average Home Value in this Area
Purchase History
| Date | Buyer | Sale Price | Title Company |
|---|---|---|---|
| Yuhasz Gary F | $88,100 | Servicelink | |
| Us Bank National Association | -- | Attorney | |
| Cavalletti Francesco | $73,000 | Tradewinds Title Inc | |
| Tamarack North Realty Llc | -- | Tradewinds Title Inc | |
| Vacca John | $32,000 | Tradewinds Title Inc |
Source: Public Records
Mortgage History
| Date | Status | Borrower | Loan Amount |
|---|---|---|---|
| Previous Owner | Cavalletti Francesco | $305,521 | |
| Previous Owner | Vacca John | $31,000 |
Source: Public Records
Tax History
| Year | Tax Paid | Tax Assessment Tax Assessment Total Assessment is a certain percentage of the fair market value that is determined by local assessors to be the total taxable value of land and additions on the property. | Land | Improvement |
|---|---|---|---|---|
| 2025 | $1,174 | $68,353 | -- | -- |
| 2024 | $1,113 | $66,427 | -- | -- |
Source: Public Records
Map
Nearby Homes
- 913 E 12th St
- 813 E 12th St
- 1312 Lake Ave
- 1206 Lake Ave
- 618 Lake Ave
- 1020 Lake Ave
- 1225 Lake Ave
- 1709 Lake Ave
- 1113 E 12th St
- 1116 8th Ave
- 1506 North Ave
- 1422 North Ave
- 1515 North Ave
- 1104 North Ave
- 1615 North Ave
- 1115 8th Ave
- 1102 Greenwood Ave
- 1708 Greenwood Ave
- 1706 Greenwood Ave
- 1121 Greenwood Ave
- 1207 Maple Ave N
- 1211 Maple Ave N Unit 3
- 1211 Maple Ave N
- 0 Corner Lot Unit R10889364
- 3204-3206 E 13th St
- 1210 Maple Ave N
- 1204 Maple Ave N
- 1216 NE Lake Ave
- 1216 Maple Ave N Unit 3
- 1216 Maple Ave N
- 1207 Lake Ave
- 1205 Highland Ave
- 1205 Lake Ave
- 909 E 12th St
- 1219 Maple Ave N
- 901 E 12th St
- 1217 Highland Ave
- 911 E 12th St
- 910 E 12th St
- 1012 E 12th St
Your Personal Tour Guide
Ask me questions while you tour the home.