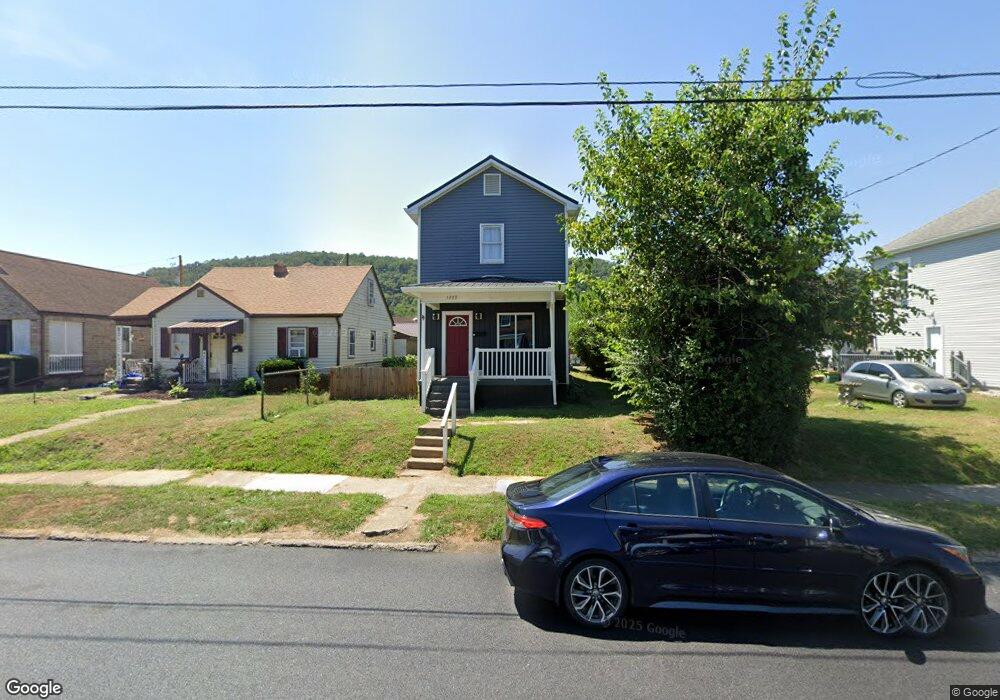
1209 N 4th St Toronto, OH 43964
Estimated Value: $123,000 - $134,543
2
Beds
2
Baths
1,152
Sq Ft
$112/Sq Ft
Est. Value
About This Home
This home is located at 1209 N 4th St, Toronto, OH 43964 and is currently estimated at $128,636, approximately $111 per square foot. 1209 N 4th St is a home located in Jefferson County with nearby schools including Toronto Jr./Sr. High School and St. Francis Central School.
Ownership History
Date
Name
Owned For
Owner Type
Purchase Details
Closed on
Nov 14, 2023
Sold by
Brandle David L
Bought by
Glatzer Janna J and Reese Jack
Current Estimated Value
Home Financials for this Owner
Home Financials are based on the most recent Mortgage that was taken out on this home.
Original Mortgage
$108,007
Outstanding Balance
$106,053
Interest Rate
7.31%
Mortgage Type
FHA
Estimated Equity
$22,583
Purchase Details
Closed on
Nov 8, 2022
Sold by
Eltringham Beverly Ann
Bought by
Brandle David L
Create a Home Valuation Report for This Property
The Home Valuation Report is an in-depth analysis detailing your home's value as well as a comparison with similar homes in the area
Home Values in the Area
Average Home Value in this Area
Purchase History
| Date | Buyer | Sale Price | Title Company |
|---|---|---|---|
| Glatzer Janna J | $110,000 | Valley Title | |
| Glatzer Janna J | $110,000 | Valley Title | |
| Brandle David L | $1,800 | -- |
Source: Public Records
Mortgage History
| Date | Status | Borrower | Loan Amount |
|---|---|---|---|
| Open | Glatzer Janna J | $108,007 | |
| Closed | Glatzer Janna J | $108,007 |
Source: Public Records
Tax History
| Year | Tax Paid | Tax Assessment Tax Assessment Total Assessment is a certain percentage of the fair market value that is determined by local assessors to be the total taxable value of land and additions on the property. | Land | Improvement |
|---|---|---|---|---|
| 2024 | $975 | $27,125 | $2,534 | $24,591 |
| 2023 | $975 | $19,272 | $2,181 | $17,091 |
| 2022 | $744 | $19,272 | $2,181 | $17,091 |
| 2021 | $744 | $19,272 | $2,181 | $17,091 |
| 2020 | $652 | $16,492 | $1,813 | $14,679 |
| 2019 | $654 | $0 | $0 | $0 |
| 2018 | $649 | $0 | $0 | $0 |
| 2017 | $302 | $0 | $0 | $0 |
| 2016 | $481 | $0 | $0 | $0 |
| 2015 | $681 | $0 | $0 | $0 |
| 2014 | $655 | $0 | $0 | $0 |
| 2012 | $322 | $15,400 | $1,925 | $13,475 |
Source: Public Records
Map
Nearby Homes