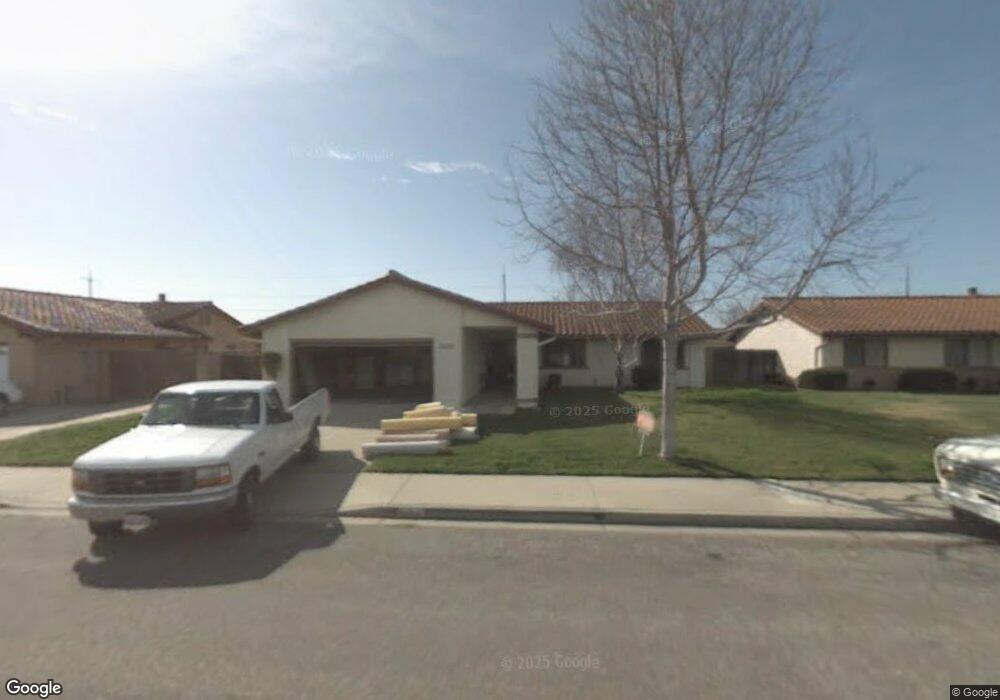
1209 N C St Lompoc, CA 93436
Estimated Value: $554,000 - $649,000
3
Beds
2
Baths
1,300
Sq Ft
$456/Sq Ft
Est. Value
About This Home
This home is located at 1209 N C St, Lompoc, CA 93436 and is currently estimated at $593,162, approximately $456 per square foot. 1209 N C St is a home located in Santa Barbara County with nearby schools including La Honda STEAM Academy, Cabrillo High School, and Olive Grove Charter - Lompoc.
Ownership History
Date
Name
Owned For
Owner Type
Purchase Details
Closed on
Feb 21, 2008
Sold by
Patel Daksa
Bought by
Patel Pankaj T and Patel Daksa P
Current Estimated Value
Purchase Details
Closed on
Jan 24, 2008
Sold by
Patel Pankaj
Bought by
Patel Daksa
Home Financials for this Owner
Home Financials are based on the most recent Mortgage that was taken out on this home.
Original Mortgage
$251,250
Interest Rate
6.62%
Mortgage Type
Purchase Money Mortgage
Purchase Details
Closed on
Dec 18, 2007
Sold by
Johnson Dolores
Bought by
Patel Daksa
Home Financials for this Owner
Home Financials are based on the most recent Mortgage that was taken out on this home.
Original Mortgage
$251,250
Interest Rate
6.62%
Mortgage Type
Purchase Money Mortgage
Create a Home Valuation Report for This Property
The Home Valuation Report is an in-depth analysis detailing your home's value as well as a comparison with similar homes in the area
Home Values in the Area
Average Home Value in this Area
Purchase History
| Date | Buyer | Sale Price | Title Company |
|---|---|---|---|
| Patel Pankaj T | -- | None Available | |
| Patel Daksa | -- | Chicago Title Company | |
| Patel Daksa | $335,000 | Chicago Title Company |
Source: Public Records
Mortgage History
| Date | Status | Borrower | Loan Amount |
|---|---|---|---|
| Previous Owner | Patel Daksa | $251,250 |
Source: Public Records
Tax History
| Year | Tax Paid | Tax Assessment Tax Assessment Total Assessment is a certain percentage of the fair market value that is determined by local assessors to be the total taxable value of land and additions on the property. | Land | Improvement |
|---|---|---|---|---|
| 2025 | $4,794 | $440,014 | $249,560 | $190,454 |
| 2023 | $4,794 | $422,929 | $239,870 | $183,059 |
| 2022 | $4,712 | $414,637 | $235,167 | $179,470 |
| 2021 | $4,144 | $353,000 | $202,000 | $151,000 |
| 2020 | $3,771 | $321,000 | $184,000 | $137,000 |
| 2019 | $3,712 | $315,000 | $180,000 | $135,000 |
| 2018 | $3,552 | $300,000 | $171,000 | $129,000 |
| 2017 | $3,392 | $286,000 | $163,000 | $123,000 |
| 2016 | $3,092 | $260,000 | $148,000 | $112,000 |
| 2014 | $2,847 | $236,000 | $134,000 | $102,000 |
Source: Public Records
Map
Nearby Homes
- 1321 Orchid St
- 100 California 1
- 1407 N H St
- 1001 E Bush Ave
- 824 Cooper Dr
- 701 E Pine Ave Unit 182
- 701 E Pine Ave Unit 176
- 701 E Pine Ave Unit 171
- 701 E Pine Ave Unit 161
- 1127 Bell Ave
- 321 W North Ave Unit 133
- 610 E Pine Ave Unit 10
- 610 E Pine Ave Unit 29
- 622 N B St
- 600 N Larkspur St
- 615 N 1st St
- 901 Alden Ave
- 505 N 1st St
- 510 N I St
- 526 N L St
Your Personal Tour Guide
Ask me questions while you tour the home.