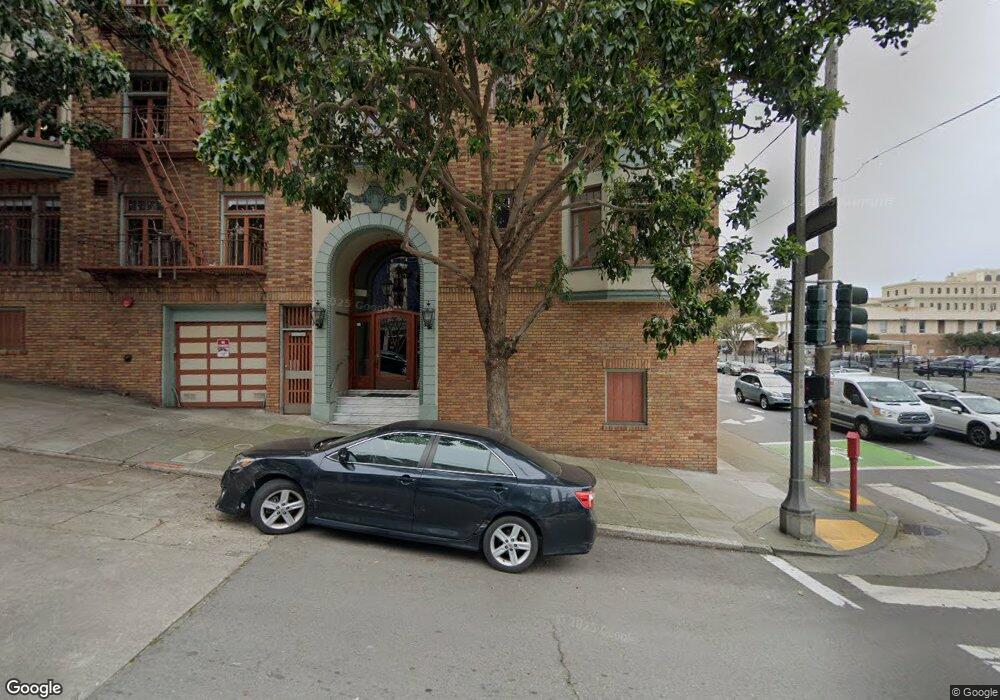
1209 Oak St Unit 1 San Francisco, CA 94117
Haight-Ashbury NeighborhoodEstimated Value: $828,537 - $954,000
1
Bed
1
Bath
800
Sq Ft
$1,117/Sq Ft
Est. Value
About This Home
This home is located at 1209 Oak St Unit 1, San Francisco, CA 94117 and is currently estimated at $893,384, approximately $1,116 per square foot. 1209 Oak St Unit 1 is a home located in San Francisco County with nearby schools including McKinley Elementary School, Everett Middle School, and Creative Arts Charter School.
Ownership History
Date
Name
Owned For
Owner Type
Purchase Details
Closed on
Apr 4, 2015
Sold by
Roques Philippe and Thayer Jeffrey
Bought by
Cocohoba Jennifer M and Vu Viet N
Current Estimated Value
Home Financials for this Owner
Home Financials are based on the most recent Mortgage that was taken out on this home.
Original Mortgage
$414,000
Outstanding Balance
$319,399
Interest Rate
3.8%
Mortgage Type
New Conventional
Estimated Equity
$573,985
Purchase Details
Closed on
Dec 17, 2004
Sold by
Concar Rachel
Bought by
Concar Edward
Home Financials for this Owner
Home Financials are based on the most recent Mortgage that was taken out on this home.
Original Mortgage
$1,195,180
Outstanding Balance
$584,150
Interest Rate
5.37%
Mortgage Type
Purchase Money Mortgage
Estimated Equity
$309,234
Create a Home Valuation Report for This Property
The Home Valuation Report is an in-depth analysis detailing your home's value as well as a comparison with similar homes in the area
Home Values in the Area
Average Home Value in this Area
Purchase History
| Date | Buyer | Sale Price | Title Company |
|---|---|---|---|
| Cocohoba Jennifer M | -- | Fidelity Natl Title Ins Co | |
| Concar Edward | -- | Chicago Title Company | |
| Concar Edward | -- | Fidelity National Title Co | |
| Roques Philippe | $1,707,500 | Fidelity National Title Co |
Source: Public Records
Mortgage History
| Date | Status | Borrower | Loan Amount |
|---|---|---|---|
| Open | Concar Edward | $414,000 | |
| Closed | Cocohoba Jennifer M | $410,000 | |
| Open | Roques Philippe | $1,195,180 | |
| Closed | Roques Philippe | $163,720 |
Source: Public Records
Tax History Compared to Growth
Tax History
| Year | Tax Paid | Tax Assessment Tax Assessment Total Assessment is a certain percentage of the fair market value that is determined by local assessors to be the total taxable value of land and additions on the property. | Land | Improvement |
|---|---|---|---|---|
| 2025 | $7,279 | $565,075 | $339,045 | $226,030 |
| 2024 | $7,279 | $553,997 | $332,398 | $221,599 |
| 2023 | $7,162 | $543,135 | $325,881 | $217,254 |
| 2022 | $7,015 | $532,487 | $319,492 | $212,995 |
| 2021 | $6,887 | $522,047 | $313,228 | $208,819 |
| 2020 | $6,983 | $516,695 | $310,017 | $206,678 |
| 2019 | $6,698 | $506,565 | $303,939 | $202,626 |
| 2018 | $6,474 | $496,633 | $297,980 | $198,653 |
| 2017 | $6,100 | $486,896 | $292,138 | $194,758 |
| 2016 | $5,981 | $477,350 | $286,410 | $190,940 |
Source: Public Records
Map
Nearby Homes
- 350 Broderick St Unit 214
- 350 Broderick St Unit 300
- 102 Baker St Unit A
- 102 Baker St Unit B
- 102 Baker St Unit C
- 972 Haight St
- 1451-1453 Hayes St
- 1059 Haight St
- 1 Baker St Unit 4B
- 1048-1050 Oak St
- 529 Broderick St Unit A
- 223 Divisadero St
- 535 Broderick St
- 1200-1202 Haight St
- 863 Haight St Unit 5
- 143 Buena Vista Ave E
- 221-223 Scott St
- 223 Scott St
- 221 Scott St
- 141 Buena Vista Ave E Unit 143
- 1209 Oak St Unit 4
- 1209 Oak St Unit 3
- 1215 Oak St
- 1215 Oak St Unit 1
- 1215 Oak St Unit 3
- 1215 Oak St
- 1205 Oak St Unit 1
- 1205 Oak St Unit 4
- 1205 Oak St Unit 3
- 291 Broderick St
- 1235 Oak St Unit 1
- 1235 Oak St Unit 4
- 1235 Oak St
- 1235 Oak St Unit 2
- 1235 Oak St Unit 3
- 1245 Oak Street Building Unit 1
- 235 Broderick St
- 1255 Oak St Unit 2
- 1255 Oak St Unit 3
- 1255 Oak St Unit 4