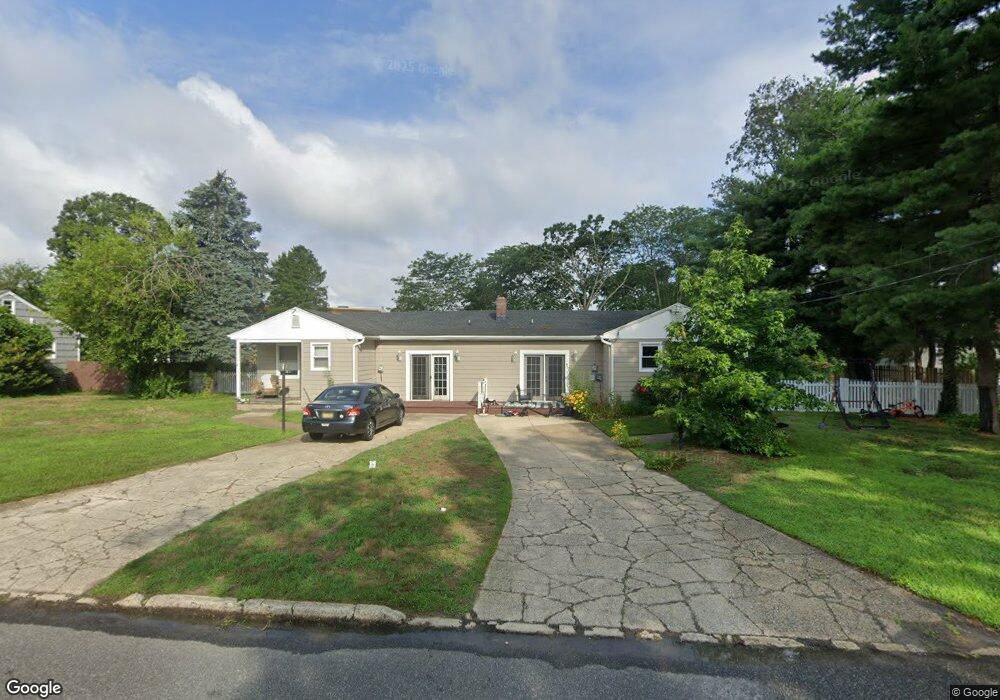
1209 Parker Ave Unit 11 Northfield, NJ 08225
Estimated Value: $476,440 - $505,000
--
Bed
--
Bath
2,516
Sq Ft
$195/Sq Ft
Est. Value
About This Home
This home is located at 1209 Parker Ave Unit 11, Northfield, NJ 08225 and is currently estimated at $490,720, approximately $195 per square foot. 1209 Parker Ave Unit 11 is a home located in Atlantic County with nearby schools including Northfield Community Elementary School, Northfield Community Middle School, and Mainland Regional High School.
Ownership History
Date
Name
Owned For
Owner Type
Purchase Details
Closed on
Nov 7, 1997
Sold by
Marincsin Joseph M
Bought by
Carney John A
Current Estimated Value
Home Financials for this Owner
Home Financials are based on the most recent Mortgage that was taken out on this home.
Original Mortgage
$121,600
Outstanding Balance
$19,868
Interest Rate
7.23%
Mortgage Type
Purchase Money Mortgage
Estimated Equity
$470,852
Purchase Details
Closed on
Sep 26, 1996
Sold by
Marincsin Halina T and Marincsin Joseph M
Bought by
Marincsin Joseph M
Create a Home Valuation Report for This Property
The Home Valuation Report is an in-depth analysis detailing your home's value as well as a comparison with similar homes in the area
Home Values in the Area
Average Home Value in this Area
Purchase History
| Date | Buyer | Sale Price | Title Company |
|---|---|---|---|
| Carney John A | $128,000 | -- | |
| Marincsin Joseph M | -- | -- |
Source: Public Records
Mortgage History
| Date | Status | Borrower | Loan Amount |
|---|---|---|---|
| Open | Carney John A | $121,600 |
Source: Public Records
Tax History Compared to Growth
Tax History
| Year | Tax Paid | Tax Assessment Tax Assessment Total Assessment is a certain percentage of the fair market value that is determined by local assessors to be the total taxable value of land and additions on the property. | Land | Improvement |
|---|---|---|---|---|
| 2025 | $8,800 | $245,000 | $70,800 | $174,200 |
| 2024 | $8,800 | $245,000 | $70,800 | $174,200 |
| 2023 | $8,555 | $245,000 | $70,800 | $174,200 |
| 2022 | $8,555 | $245,000 | $70,800 | $174,200 |
| 2021 | $8,465 | $245,000 | $70,800 | $174,200 |
| 2020 | $9,031 | $260,400 | $70,800 | $189,600 |
| 2019 | $8,877 | $260,400 | $70,800 | $189,600 |
| 2018 | $8,718 | $260,400 | $70,800 | $189,600 |
| 2017 | $8,429 | $260,400 | $70,800 | $189,600 |
| 2016 | $8,093 | $260,400 | $70,800 | $189,600 |
| 2015 | $7,981 | $260,400 | $70,800 | $189,600 |
| 2014 | $7,546 | $260,400 | $70,800 | $189,600 |
Source: Public Records
Map
Nearby Homes